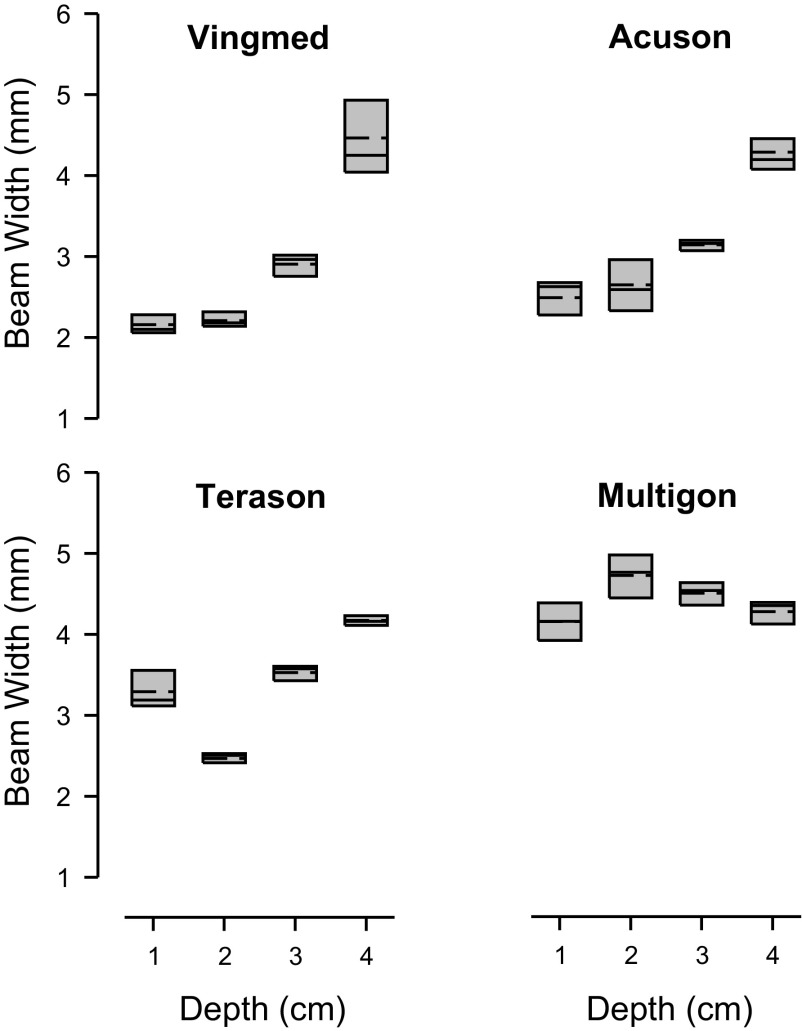
Fig. 3.
Box plots of the beam width for four ultrasound systems. Bam width was determined at each of four depths as indicated. Boundary of the box closest to zero denotes 25th percentile, solid line within the box denotes median, dashed line denotes mean, and the boundary of the box farthest from zero denotes 75th percentile. Median beam width at each depth was used for subsequent correction of mean velocities.

