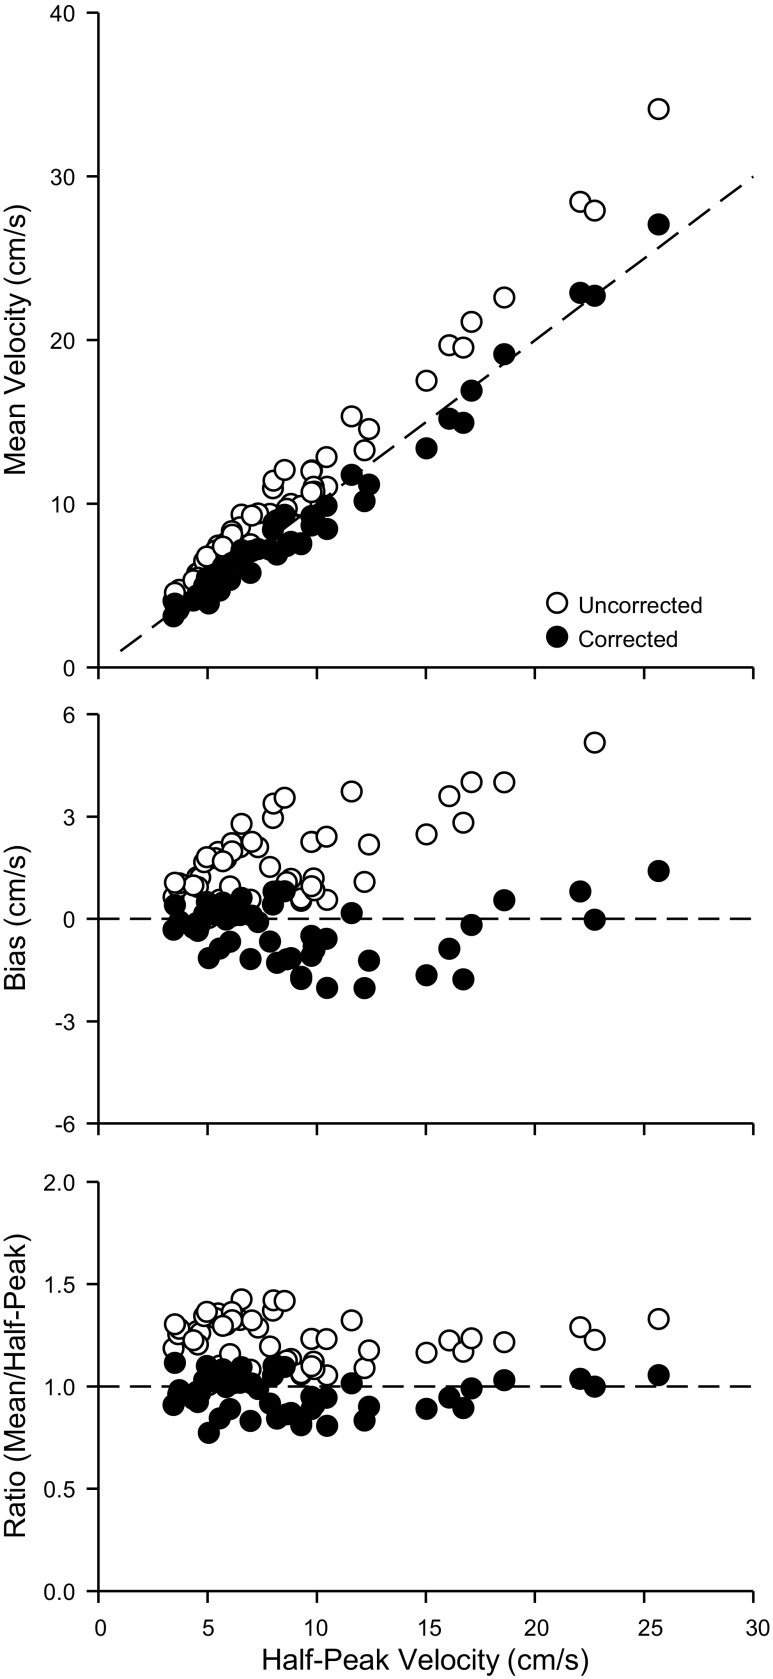
Fig. 5.
In vivo Doppler mean velocity estimates. Top: uncorrected mean velocity (open circles) and corrected mean velocity (solid circles) vs. half-peak velocity. Dashed line represents the line of identity. Middle: bias between uncorrected mean velocity and corrected mean velocity relative to half-peak velocity (calculated as corrected or uncorrected mean minus half-peak). Dashed line represents bias of 0. Bottom: ratio of the uncorrected or corrected mean velocity to the half-peak velocity. Dashed line represents a ratio of 1 to 1.

