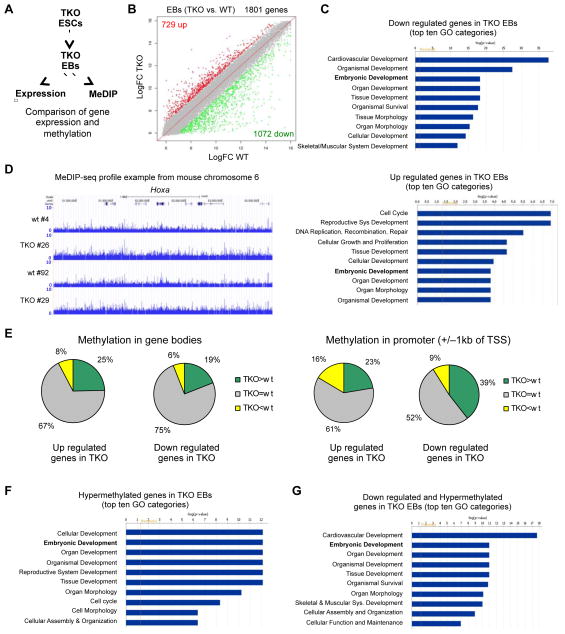
Figure 3. Aberrant promoter hypermethylation and deregulation of developmental genes in Tet TKO embryoid bodies.
A) Schematic of the MeDIP and gene expression analyses to identify hypermethylated and down regulated genes during differentiation of TKO ES cells.
B) Scatter plots showing differentially expressed genes in red (up regulated) or in green (down regulated) across a panel of TKO EBs when compared to WT EBs.
C) Gene ontology analysis of differentially expressed genes in TKO EBs.
D) MeDIP-seq profile of a 3 Mb region from mouse chromosome 6 with the Hoxa cluster in the center in two independent TKO and WT EB clones as an example for the general hypermethylation observed in TKO EBs. Enrichments are indicated as normalized read counts.
E) Analysis of deregulated genes in TKO EBs correlating their expression to the methylation status of their promoters or gene bodies. The pie charts show the percentage of deregulated genes in TKO EBs that show hypermethylation compared to WT (green), hypomethylation compared to WT (yellow) or do not change (grey), in the gene body or the promoter (+/− 1000 bp from the TSS).
F) Gene ontology analysis of all genes with hypermethylated promoter regions (normalized average read counts > 4 in the region +/− 1000 bp from the TSS) in TKO EBs.
G) Gene ontology analysis of all genes down regulated in TKO EBs that also have differentially hypermethylated promoters (TKO vs. WT).
(See also Table S1)

