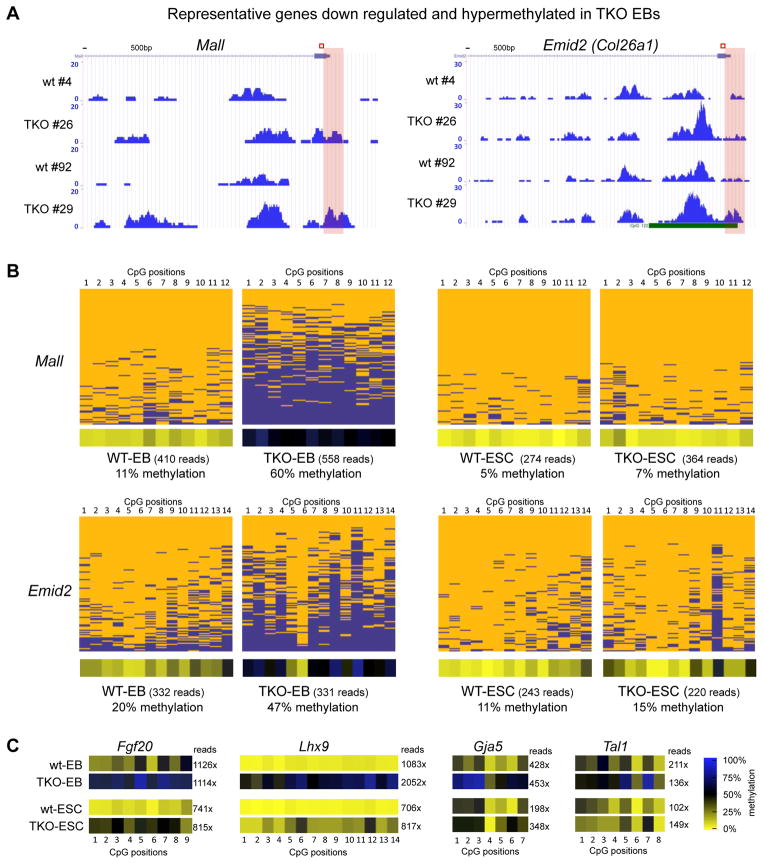
Figure 4. Gene specific bisulfite sequencing for validation of hypermethylation of deregulated developmental genes in Tet TKO embryoid bodies.
A) MeDIP-seq profiles of representative developmental genes in TKO EBs. Enrichments are indicated as normalized read counts. Red boxes indicate the genomic region analyzed by gene specific 454 bisulfite sequencing in B and C.
B) Validation of MeDIP-data by gene specific 454 bisulfite sequencing. Results for a 200–300 bp region (see red box in A) at the promoters of indicated genes are shown as heatmaps in which each row represents one sequence read and each column an individual CpG site within the analyzed region. Individual blue boxes indicate methylated and yellow boxes indicate unmethylated CpG dinucleotides. Panels below heatmaps show the average methylation of each interrogated CpG for the analyzed DNA fragment. For color bar see C. Sequencing coverage (reads) are indicated.
C) Heat maps for four additional promoter regions of the genes analyzed. Panels show the average methylation of each interrogated CpG according to the color bar shown on the right. Numbers indicate the sequencing coverage.
(See also Figure S3)

