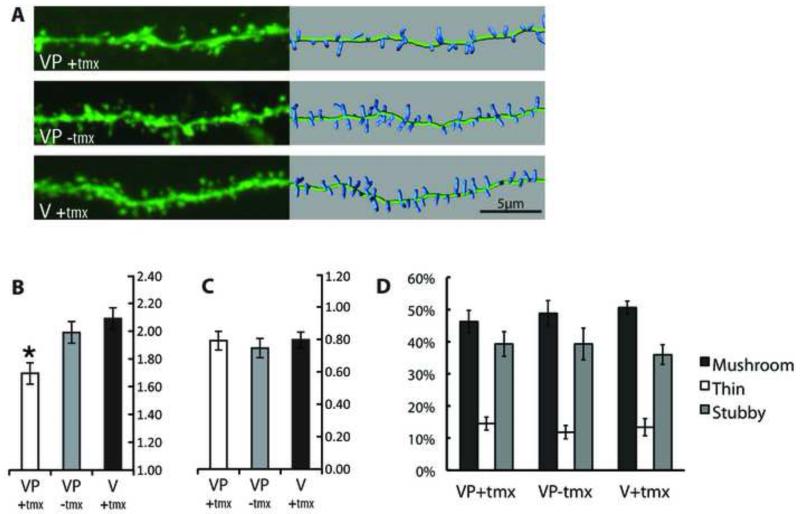
Figure 2. Cell-autonomous effects of TeTxLC expression on dendritic spines in vivo.
YFP-labeled CA1 hippocampal neurons from GFP-TeTxLC expressing and control mice were imaged by confocal microscopy. Tamoxifen-treated SLICK-V; RC::Ptox (VP(+)tmx) mice were compared to untreated SLICK-V; RC::Ptox (VP(−)tmx) and tamoxifen-treated SLICK-V (V(+)tmx) control mice.
(A) Representative dendritic segments for the three treatment groups. The left panel shows confocal projections and the right panel shows 3D representations of spines used for quantification. Spine densities of the segments shown for each treatment group are 1.6919, 1.990, and 2.0973 spines/μm respectively.
(B) Quantification of spine density organized by treatment group. Each bar comprises data from 8 mice, with a total of 39-42 cells, 3,500+ μm of dendrite length and 6,000+ spines analyzed per treatment group. Mean spine densities for VP(+)tmx, VP(−)tmx and V(+)tmx are 1.696, 1.990, and 2.088 respectively (in spines/μm). * Using three post-hoc tests (Tukey’s studentized range, Gabriel’s comparison intervals and Dunnett’s t-test) spine density for VP(+)tmx is found to be significantly reduced compared to both control groups (p<0.05). The mean difference between the two control groups VP(−)tmx and V(+)tmx is not significant. Error bar values represent Gabriel’s confidence intervals, which indicate significance (p<0.05) when intervals do not overlap.
(C) Quantification of spine length organized by treatment group. Mean spine lengths for VP(+)tmx, VP(−)tmx and V(+)tmx are 0.800, 0.756, and 0.807 respectively (in spines/μm). A nested ANOVA shows that none of the relationships between groups is significant (p>0.05). Error bars represent 95% confidence intervals.
(D) Classification of spine morphology. Spines are classified as mushroom, thin and stubby and the percentage in each category is plotted for each treatment group. An ANOVA shows that none of the relationships between groups is significant (p>0.05). Error bars represent standard error of the mean.

