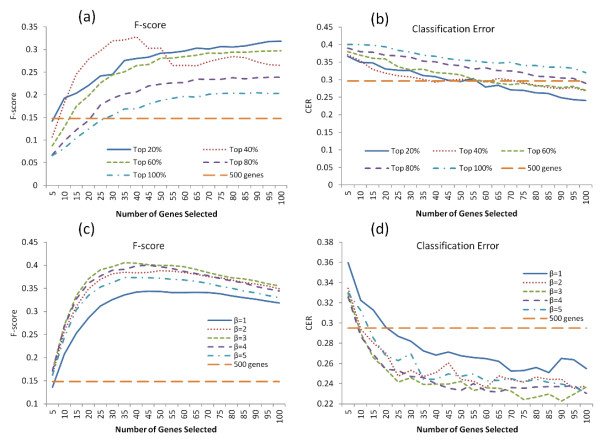
Figure 1.

Performance of variable selection. The averaged F-scores (a, c) and the CER curves (b, d) in hard thresholding and soft thresholding transformation, respectively. The horizontal line in each plot represents the performance based on all genes (500 totally).
