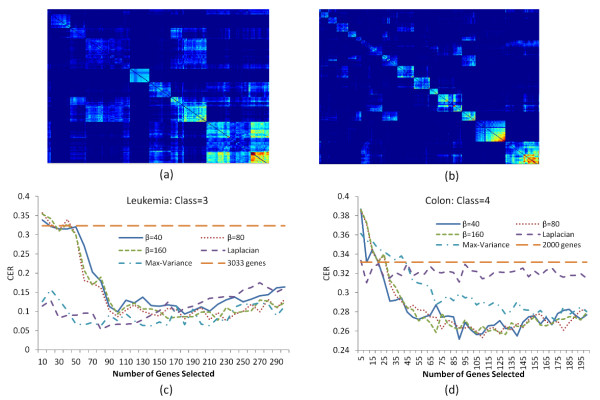
Figure 4.

Module analysis and clustering results for the leukemia and colon datasets. Top panel: Zoomed-in view of the module composition in the gene co-expression matrices of the Leukemia (a) and Colon dataset (b). Bottom panel: The CER curves based on soft thresholding transformation with various power functions for three clusters of Leukemia dataset (c) and four clusters of Colon cancer dataset (d).
