
Figure 7.
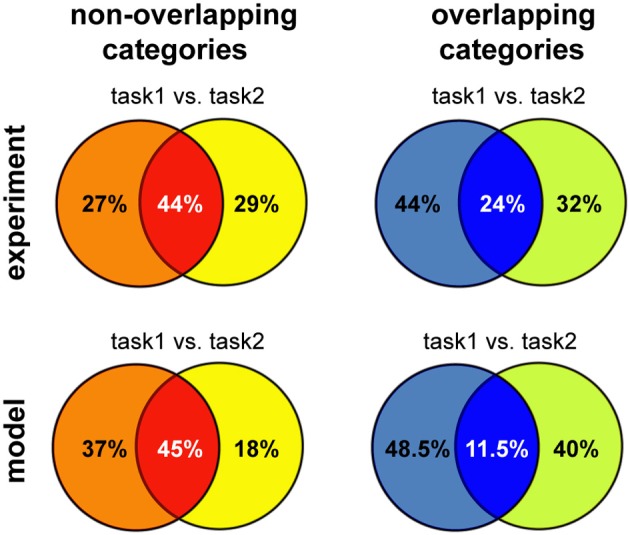
Summary of the results for different versions of multitask categorization; comparison between model and experiments. The category specificity at the end of learning was measured for the two variants of the multiple-category task using either overlapping or non-overlapping category boundaries. We restricted the analysis to the subset of neurons that showed any task specificity (defined as S ≥ Sspecific), as done for the experimental data analysis; the proportion of these neurons that are selective to one or both of the category boundaries was reported, averaging across five runs; Tmax = 5 and Sspecific = 0.75 for the non-overlapping version and Tmax = 3 and Sspecific = 0.5 for the overlapping categories discrimination, reflecting the increase in task difficulty. Experimental data reproduced from Cromer et al. (2010) for non-overlapping and from Roy et al. (2010) for overlapping categories, respectively.