Fig. 3.
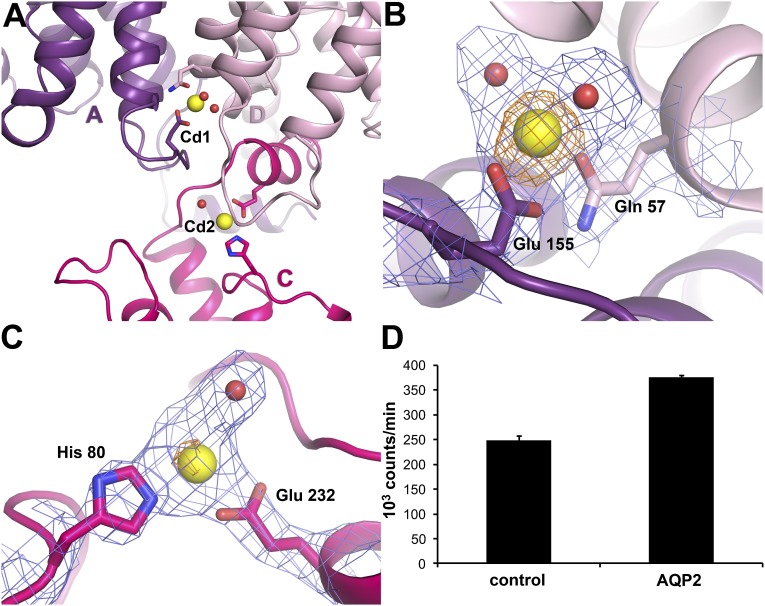
Cd2+ binding sites in AQP2. (A) Two Cd2+ binding sites (Cd1 and Cd2) are found on the cytoplasmic side of the AQP2 tetramer. Yellow spheres represent Cd2+. The interaction between the C-terminal helix of protomer C (pink) with protomer D (light pink) of a symmetry-related tetramer is also shown. (B) Electron density for the Cd1 site showing 2Fobs–Fcalc map contoured at 1.5 σ (blue) and anomalous difference map contoured at 3.5 σ (orange). Residues serving as Cd2+ ligands are shown in stick representation. Water molecules ligating the Cd2+ ion are shown as red spheres. (C) Electron density for the Cd2 site showing a 2Fobs–Fcalc map contoured at 1.2 σ (blue) and anomalous difference map contoured at 3.5 σ (orange). Cd2+ ligands are displayed as in B. (D) Radioactive Ca2+ binding assay illustrating how AQP2-expressing Xenopus oocytes bind significantly more 45Ca2+ (P < 0.05) than controls, suggesting that Ca2+ is the physiological ligand for the Cd+ binding sites. Mean ± SEM is given of three groups of 10 oocytes per condition.

