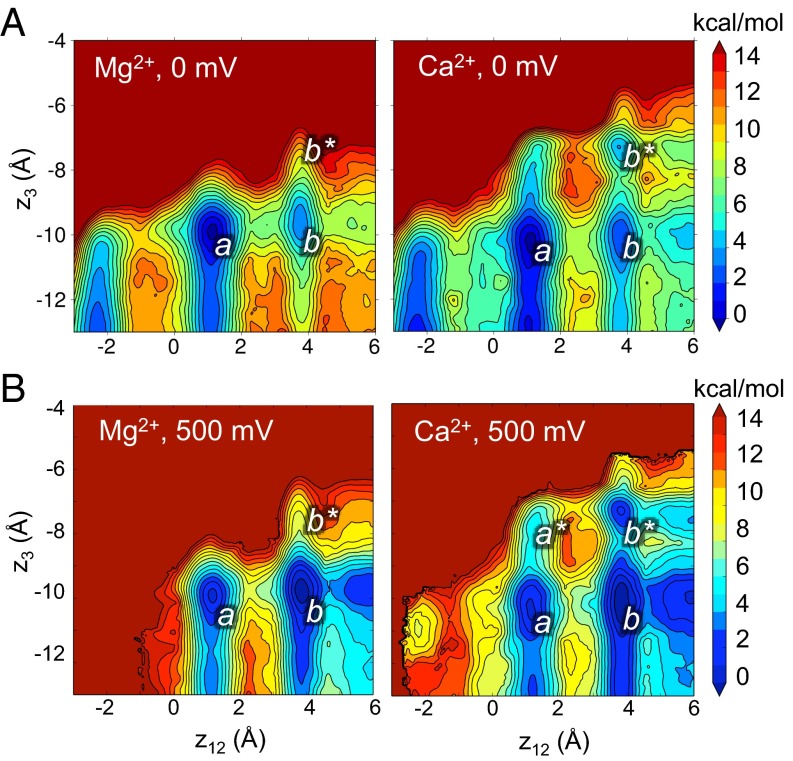
Fig. 5.
Energetic relations among ion binding configurations in the MthK pore. (A) Free energy of ion configurations as a function of K+ ion positions (z12) and Ca2+ or Mg2+ (z3) from simulations performed at 0 mV. Ca2+, but not Mg2+, occupies an energy well located at S5 (z3 = −7.5 Å; indicated by b*), with K+ ions driven to the extracellular end of the selectivity filter (z12 = 3.5 Å). Colors correspond to free energies (in kilocalories per mol) as indicated in the scale bar on the right. (B) Free energy of ion configurations from simulations performed with 500 mV depolarizing voltage. Depolarization drives K+ ions to the extracellular end of the filter (z12 = 3.5 Å) and permits Ca2+ to bind more stably at S5. In A and B, z12 corresponds to the center of mass of pairs of K+ ions in the filter relative to the center of mass of the selectivity filter; z3 represents the position of the Ca2+ or Mg2+ ion (as indicated) relative to the center of mass of the selectivity filter.

