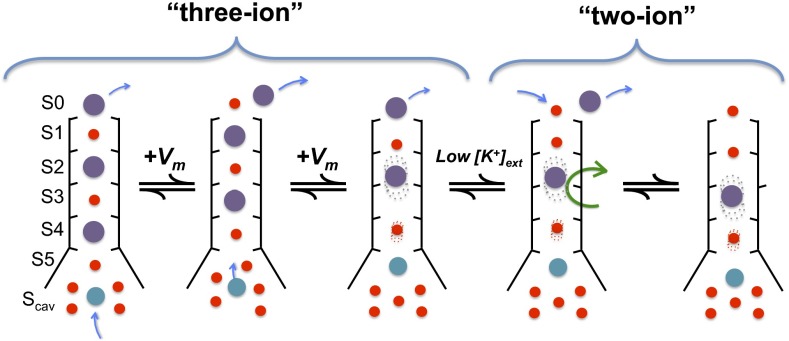
Fig. 9.
Working hypothesis of initial steps in MthK inactivation. Schematic diagram of the MthK selectivity filter in a series of different ion occupancy states. From the state (far left) with K+ ions occupying the S0/S2/S4 positions (purple spheres), one Ca2+ (cyan sphere) occupies the Scav position. Depolarization drives the K+ ions outward in register as Ca2+ moves to the S5 position. Lowered extracellular [K+] drives the filter from the three-ion states to the two-ion states by lowering the probability of K+ rebinding after its dissociation from S0. In the final step (far right), carbonyl rotation occurs (indicated by the green arrow), leading to inactivation.

