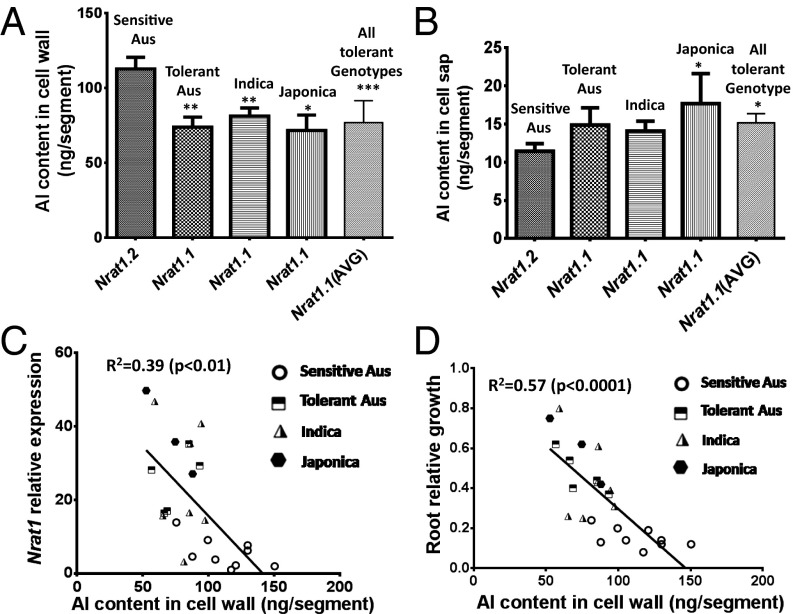
Fig. 3.
Root Al content, Al tolerance, and NRAT1 expression in the 24 diverse rice accessions. (A) Cell wall Al content for the Al-sensitive aus lines carrying the Al-sensitive NRAT1.1 allele compared with the rice lines carrying the Al-tolerant NRAT1.1 allele (tolerant aus, indica, japonica, and the mean for all lines expressing the tolerant NRAT1.1 allele).(B) Cell sap Al content for the same five groupings of rice lines examined in A. (C) The relationship between NRAT1 expression and cell wall Al content. (D) The relationship between Al tolerance [relative root growth (RRG)] and cell wall Al content. Regression analysis was conducted on the data for each individual rice line from the 24 line diversity panel. Values are the mean ± SE. In A and B, asterisks indicate significant differences as determined by t tests (*P < 0.05, **P < 0.01, ***P < 0.001).

