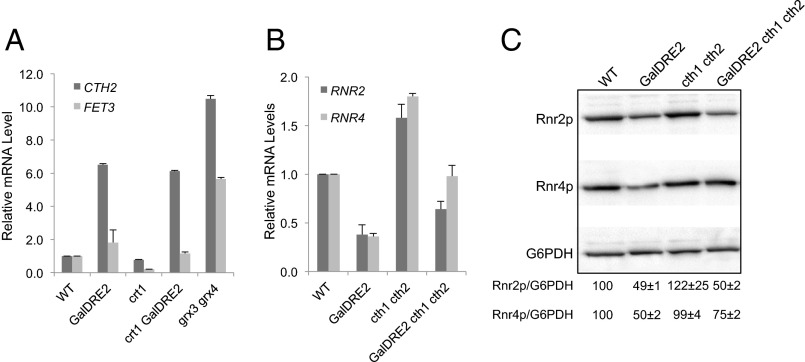
Fig. 3.
The decrease in ββ′ levels in the GalDRE2 mutant is mediated by CTH1/CTH2. (A) CTH2 is induced in the GalDRE2 mutant. Levels of CTH2 and FET3 mRNAs in WT, GalDRE2, Δcrt1, and Δcrt1GalDRE2 cells were determined by reverse transcription and RT-qPCR. Signals of CTH2 and FET3 were normalized against that of ACT1 in each strain, and the resulting ratios in WT cells were arbitrarily defined as onefold. Mutant Δgrx3Δgrx4 was included as a positive control for iron regulon activation (41). (B) Comparison of RNR2 and RNR4 mRNA levels in WT, GalDRE2, Δcth1Δcth2, and GalDRE2Δcth1Δcth2 cells by RT-qPCR as described in A. (C) Comparison of Rnr2 (β) and Rnr4 (β′) protein levels in WT, GalDRE2, Δcth1Δcth2, and GalDRE2Δcth1Δcth2 cells by Western blot with G6PDH as a loading control. Rnr2/G6PDH ratios were quantified, and the average and SD from triplicates are shown.

