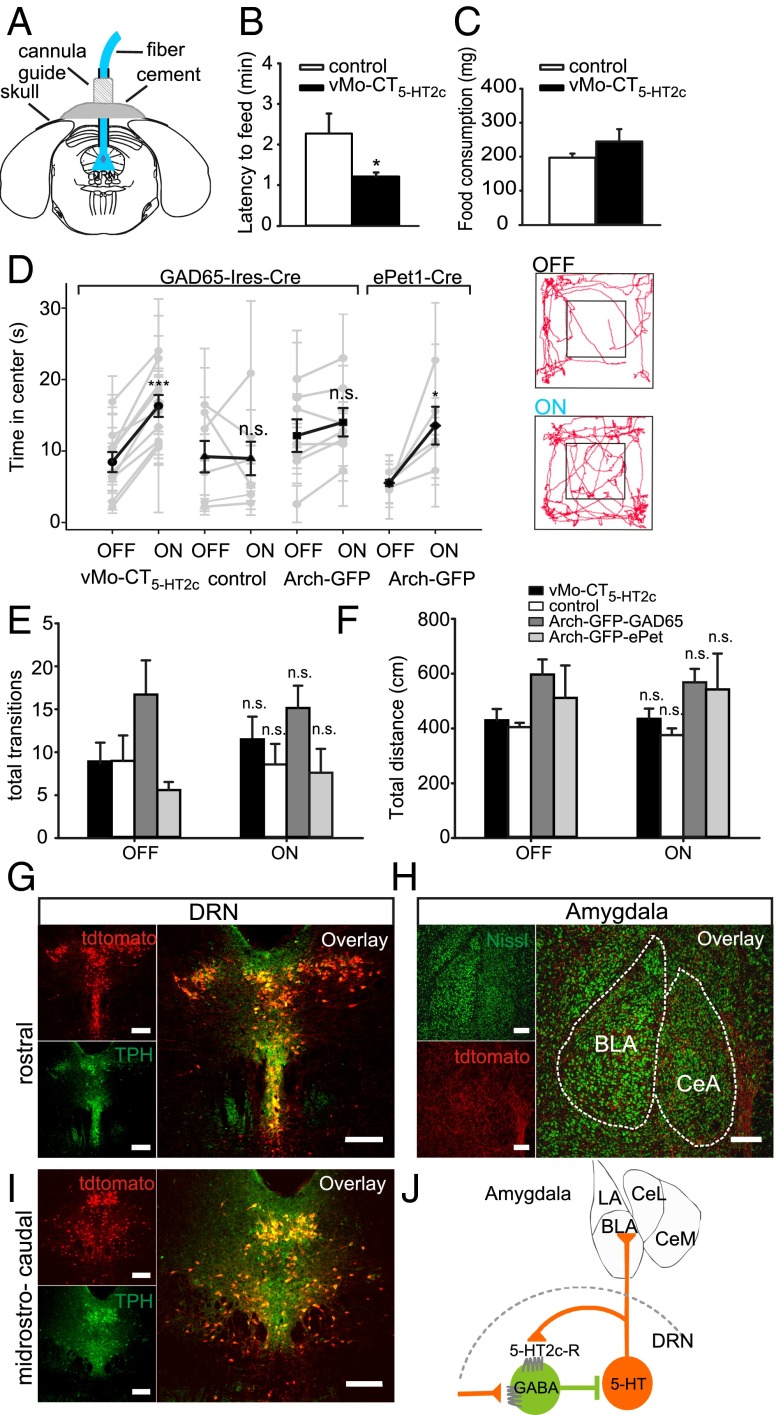
Fig. 4.
Light activation of vMo-CT5-HT2c specifically in GABAergic neurons relieves anxiety behavior through inhibition of serotonergic neurons. (A–C) NSF. (A) Stereotactic targeting of the DRN through a cannula guide in vivo. (B) Constant illumination with blue light significantly decreased latency to feed in a novel environment. Control group (white), n = 4 animals; vMo-CT5-HT2c group (black), n = 5 animals. (C) Food consumption during NSF was not altered in both groups. (D–F) OFT. (D) Comparison of center time duration in the OFT without light stimulation (OFF) and with light stimulation (ON). Individual traces (light gray) and mean center time duration (black) for GAD65-Ires-Cre mice injected with AAV-DIO-vMo-CT5-HT2c (n = 10 animals), AAV-eGFP (n = 7 animals), or AAV-flex-Arch-GFP (n = 7 animals) and ePet1-Cre mice injected with AAV-flex-Arch-GFP (n = 5 animals). Numerical data are provided in the text. (Right) Exemplary paths demonstrating increased center time in the OFT during light-on epochs for a vMo-CT5-HT2c–injected animal. (E and F) Border-to-center transitions and total distance traveled in the OFT for control (white; n = 7 animals), vMo-CT5-HT2c in GAD65-Ires-Cre–expressing mice (black; n = 10 animals), Arch-GFP in GAD65-Cre–expressing mice (dark gray; n = 7 animals), and Arch-GFP in ePet1-Cre–expressing mice (light gray; n = 5 animals) without (OFF) and with (ON) constant blue light stimulation. (G–I) DRN serotonergic projections into the amygdala. Serotonergic projection sites in ePet1-Cre transgenic mice were analyzed using AAV2/1.CAG.FLEX.tdTomato.WPRE. bGH tracer virus. (G and I) tdTomato expression (red) at two distinct dorsal raphe sites (rostral and midrostrocaudal). Colabeling for TPH (green) shows restricted expression in 5-HT containing cells (yellow). (H) tdTomato expression of 5-HT containing nerve terminals in the amygdala (red) of an ePet1-Cre transgenic mouse colabeled with fluorescent Nissl (green). The overlay shows 5-HT innervation sites in the basolateral amygdala (BLA) and central amygdala (CeA); boundaries are outlined by dashed lines. (J) Schematic representation of a purposed dorsal raphe–amygdala circuit comprising 5-HT2c-Rs to control anxious behavior. LA, basolateral amygdaloid nucleus, CeL, central amygdaloid nucleus, lateral devision, CeM, central amygdaloid nucleus, medial devision. (Scale bars: 200 µm in G–I.)

