Fig. 3.
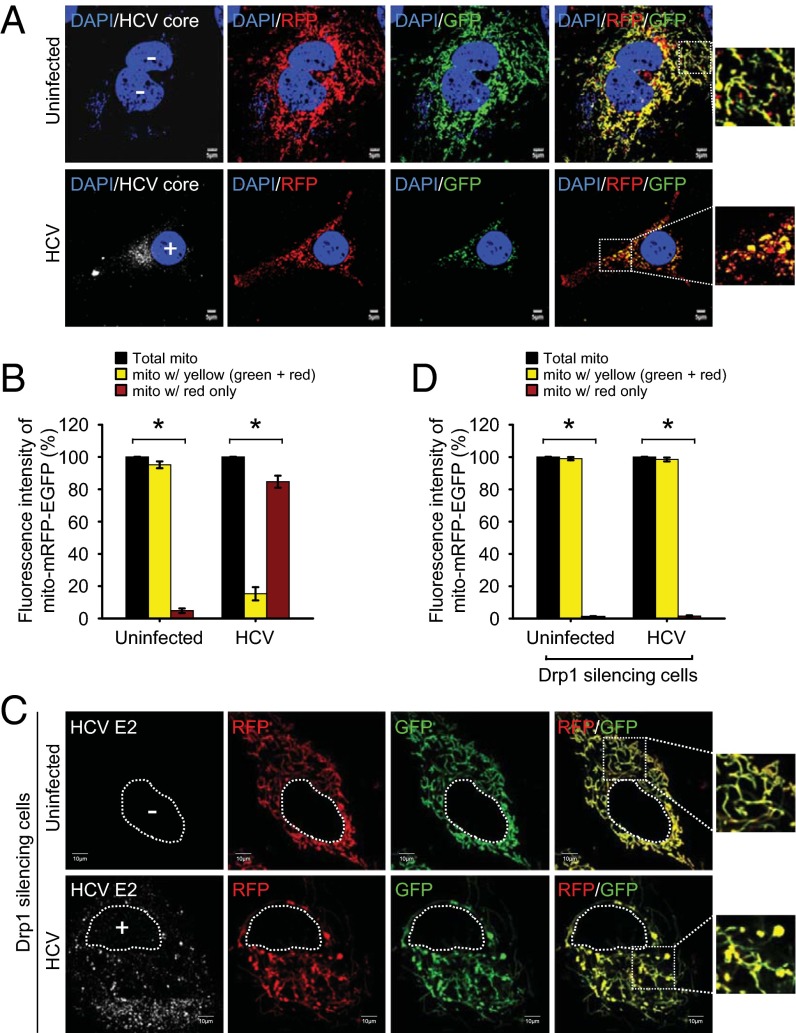
HCV induces mitophagy. (A) Confocal images showing HCV-induced mitophagy. HCV-infected cells transiently expressing mito-mRFP-EGFP were immunostained with anti-HCV core antibody (white). Nuclei, DAPI (blue). Infected cells, +; uninfected cells, −. In the zoomed images, fluorescence signals indicate the expression of mito-mRFP-EGFP targeting mitochondria: yellow color, no mitophagy; red color, mitophagy. (C) Confocal images showing the inhibition of HCV-induced mitophagy by silencing Drp1. Drp1-silenced HCV-infected cells transiently expressing mito-mRFP-EGFP were immunostained with anti-HCV E2 antibody (white). Nuclei, white dots circle. Infected cells, +; uninfected cells, −. In the zoomed images, tubular mitochondria in uninfected cells and tubular/swollen mitochondria in infected cells are shown. (B and D) Quantitative analyses of the fluorescence signal targeted to mitochondria in A and C, respectively (mean ± SEM; n ≥ 10 cells; *P ≤ 0.01, by unpaired Student t test).

