Fig. 2.
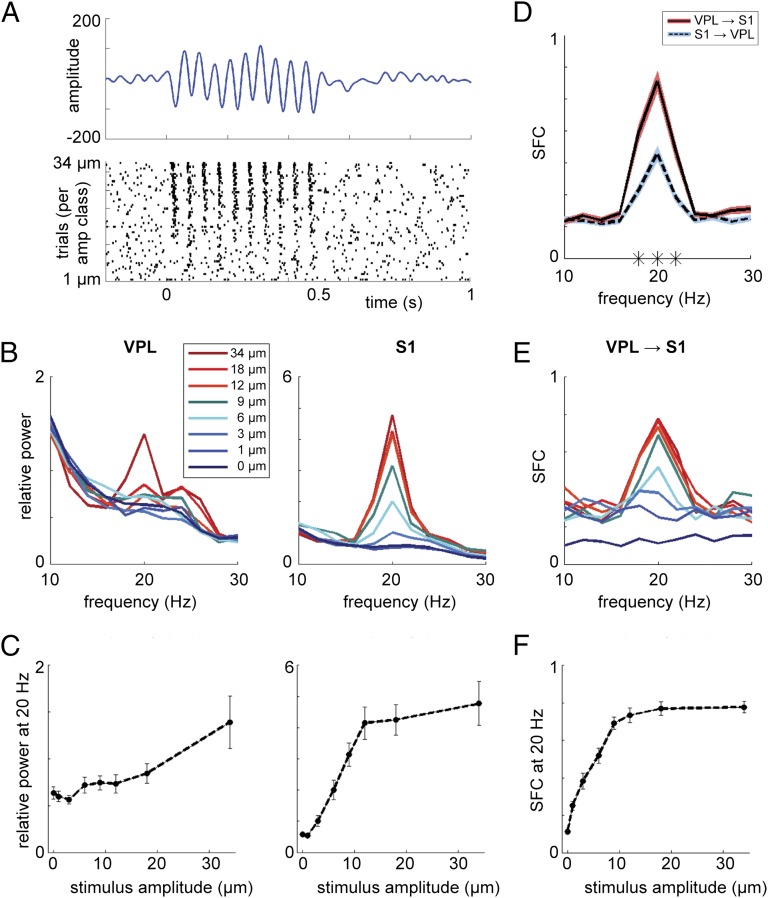
Amplitude modulation. (A, Upper) LFP-evoked response for the active stimulus-present trials in one representative recording in S1 in m26. (Lower) Spike raster plot for the same recording, plotted per trial, sorted for stimulus amplitude. (B) Power spectra during the stimulus window (t = 0–0.5 s) averaged over trials per stimulus-amplitude class (showing one subset of stimuli for m26) in VPL (Left) and S1 (Right). (C) Graphs showing positive modulation of 20-Hz power by the stimulus amplitude for both VPL (Left; r = 0.881, P < 0.01) and S1 (Right; r = 0.976, P < 0.001). Error bars indicate the SEM. (D) SFC for VPL spikes, S1 fields (red), and S1 spikes, VPL fields (blue), averaged over all stimulus-present trials in the active condition, in m26. A significant difference was observed around the 20-Hz peak for the VPL–S1 vs. S1–VPL SFC (indicated by asterisks; cluster-corrected P < 0.001). (E) Similar to B but showing the SFC for VPL–S1. (F) Similar to C but showing the SFC for VPL–S1 (r = 1, P < 0.001).

