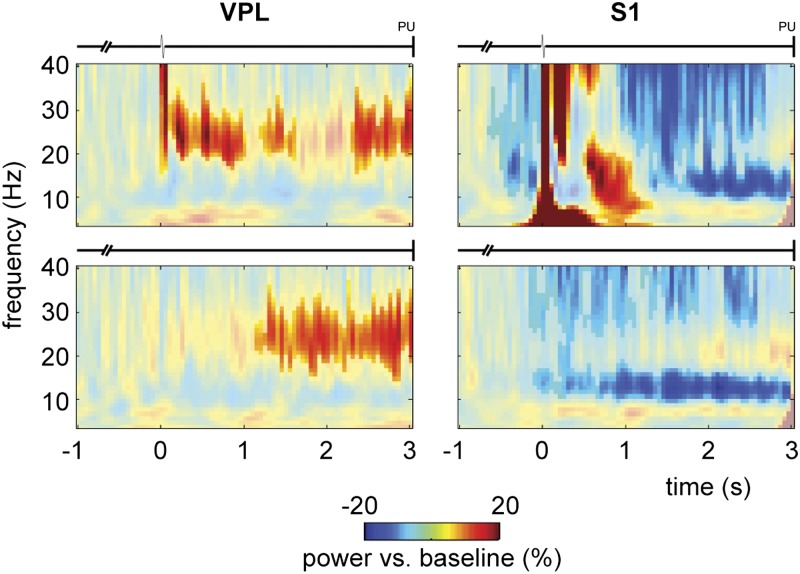
Fig. 4.
Oscillatory activity during somatosensory detection task: 1-pulse. TFRs of power (4–40 Hz) for stimulus-present (Upper) and stimulus-absent trials (Lower) for VPL (Left; n = 26 sites) and S1 (Right; n = 43 sites) in m26. Power is masked for significant results (cluster-corrected P < 0.05), based on a nonparametric randomization test of task-related activity (stimulus window t = 0–0.05 s and poststimulus window t = 0.05–3 s) vs. baseline (t = −1 to −0.5 s).

