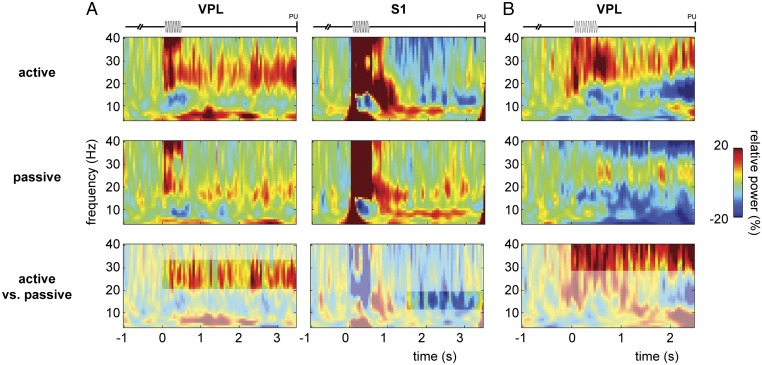
Fig. 5.
Oscillatory activity during somatosensory detection task for the active vs. passive condition. (A) TFRs of power (4–40 Hz) for the active (Top) and (Middle) passive conditions for VPL (Left; n = 21 sites) and S1 (Right; n = 35 sites) in m26. (Bottom) Comparison between active vs. passive conditions, masked for significant results (cluster-corrected P < 0.05) based on a nonparametric randomization test. Trials were stratified such that both conditions contained the same number of trials per amplitude class. (B) Similar presentation for VPL in m27 (n = 11 sites). Note that for m27, the poststimulus window was shorter (t = 0.5–2.5 s).

