Fig. 8.
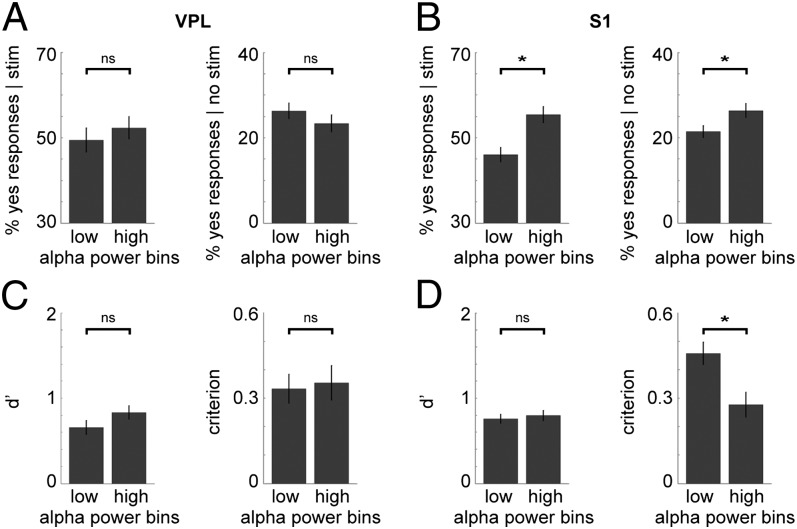
Prestimulus alpha power in S1 influences detection performance: one-pulse task. (A) Bar graphs showing no significant difference in performance between trials with low and those with high prestimulus alpha power in VPL (n = 26 sites), for both stimulus-present (Left) and stimulus-absent (Right) trials, for the one-pulse experiment. Error bars indicate the SEM. (B) Similar graphs for S1 (n = 43 sites), showing a significant difference in performance. Higher prestimulus alpha power increased the probability of a yes response, for both stimulus-present (P < 0.001) and stimulus-absent trials (P < 0.05). (C) Bar graphs showing the d′ and criterion for low vs. high prestimulus alpha trials in VPL. There was no significant difference in the d′ or the criterion. (D) Similar graphs for S1. There was no significant difference in the d′, whereas the criterion was significantly lower for high prestimulus alpha trials (P < 0.001).

