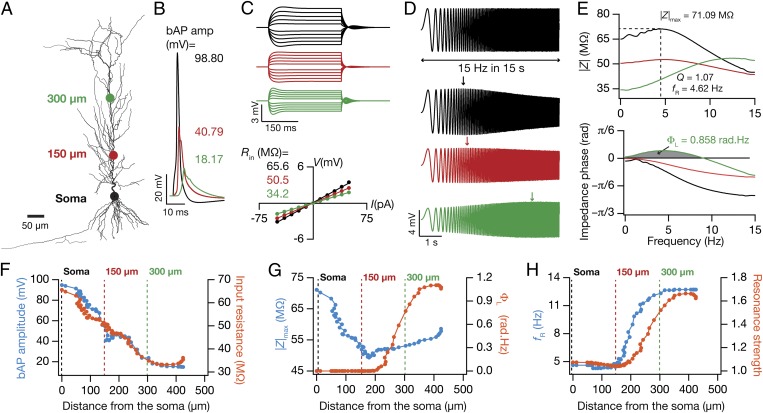
Fig. 1.
Six experimentally constrained functional maps in the base model neuron. (A) A projection of a reconstructed CA1 pyramidal neuron, depicting the locations where example measurements of electrophysiological properties are provided. The color codes of the dots represent locations in B–H. (B) Back-propagating action potential (bAP) traces in response to 1-nA somatic current injection for 2 ms. (C) Upper, voltage traces in response to a local 300-ms current injection from –50 pA to 50 pA in steps of 10 pA for different locations. Lower, steady-state voltage response, obtained from traces above, plotted against the corresponding current amplitude. Slope of the best linear fit to this V–I plot defined input resistance (Rin). (D) A chirp current stimulus, 100 pA in peak-to-peak amplitude and frequency linearly increasing from 0.1 Hz to 15 Hz in 15 s (Upper) was injected at different locations to record local voltage responses (Lower). (E) Impedance amplitude profiles [|Z(f)|, Upper] and impedance phase profiles [ϕ(f), Lower] obtained from corresponding voltage responses to the chirp stimulus (D). The frequency at which the |Z(f)| assumed its maximum value (|Z|max) was taken as resonance frequency, fR. Resonance strength, Q, was defined as the ratio of |Z(fR)| to |Z(0.5)|. Gray shaded area in ϕ(f) measures the total inductive phase, ΦL. (F–H) Functional maps corresponding to bAP and Rin (F), |Z|max and ΦL (G), and fR and Q (H) along the somatoapical trunk of the baseline model. See Fig. S1 for the experimental counterparts of measurements shown in F–H.

