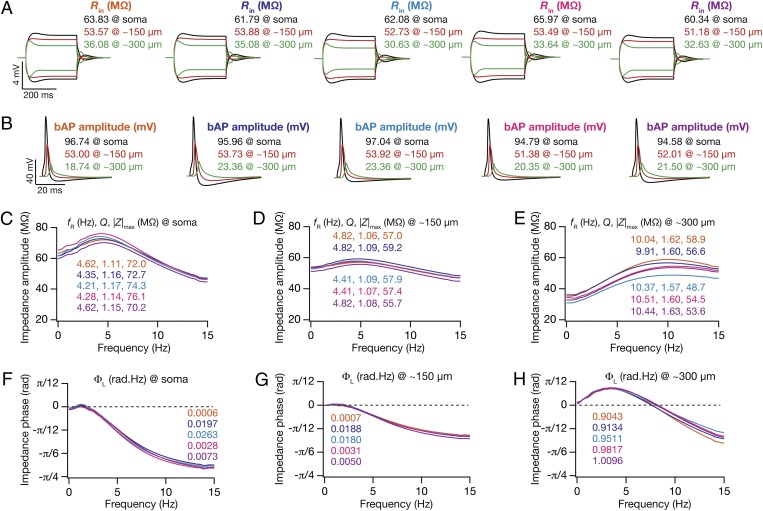
Fig. 2.
Five randomly chosen valid models were analogous across all 18 somatodendritic measurements. All traces and measurements depicted correspond to the same set of five valid models, at the same somatodendritic locations shown in Fig. 1A. (A) Voltage traces in response to –50-pA and 50-pA current injection at three locations and corresponding input resistance (Rin) values. (B) Back-propagating action potential (bAP) traces at three locations and their corresponding amplitudes. (C–E) Impedance amplitude profile [|Z(f)|] plotted for three locations, soma (C), ∼150 µm (D), and ∼300 µm (E), with corresponding values of resonance frequency (fR), resonance strength (Q), and maximal impedance amplitude (|Z|max) values. (F–H) Impedance phase profile [ϕ(f)] plotted for three locations indicating corresponding values of total inductive phase (ΦL).

