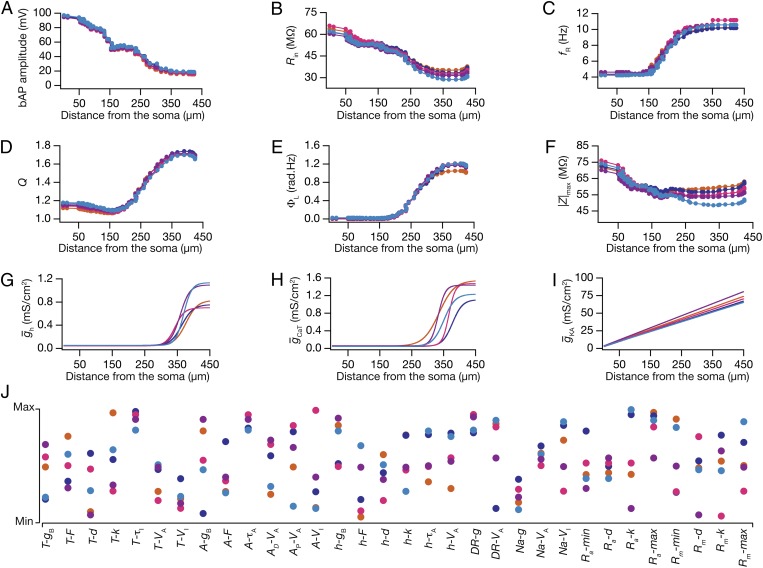
Fig. 3.
In five randomly chosen valid models, analogous functional maps of all six measurements emerged in the absence of individual channelostasis in the underlying channel population. All functional maps and underlying parametric combinations depicted here correspond to the same set of five valid models in Fig. 2. The color codes for different models in Fig. 2 are followed here as well. (A–F) Functional maps of back-propagating action potential (bAP) amplitude (A), input resistance (Rin) (B), resonance frequency (fR) (C), resonance strength (Q) (D), total inductive phase (ΦL) (E), and maximum impedance amplitude (|Z|max) (F) represented along the somato-apical topograph of five valid models. (G–I) Distribution of h (G), CaT (H), and KA (I) conductances along the somato-apical trunk of the five valid models. (J) Distribution of all underlying model parameters in the five valid model neurons depicted along with their respective minimum–maximum range. Each colored circle represents parameters of the color-matched model depicted in A–I and in Fig. 2.

