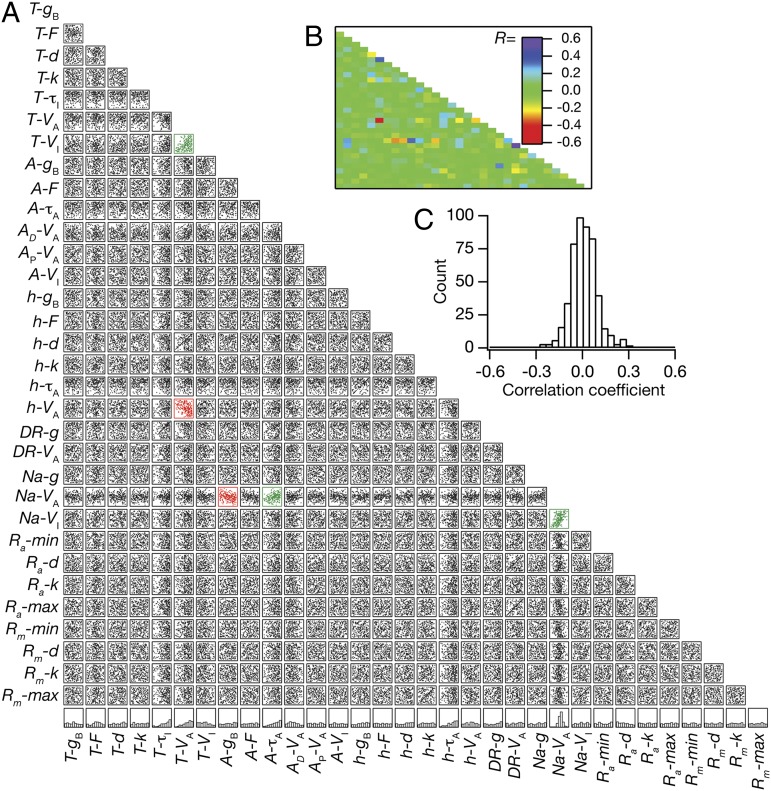
Fig. 4.
Weak pairwise correlations between parameters underlying the valid model population. (A) Lower diagonal of a matrix depicting interactions among the 32 parameters derived from all valid models (n = 228). Each subpanel depicts a scatter plot of the values of 2 parameters (labeled at bottom and at left) derived from all valid models. Correlation coefficients were computed for each of the scatter plots, and red scatter plots indicate that the value of the correlation coefficient was less than −0.3, whereas the green scatter plots indicate that the value of the correlation coefficient was greater than 0.3. The bottommost row denotes normalized histograms of individual parameters in the valid model population. (B) Lower diagonal of a color-coded matrix of correlation coefficients corresponding to the scatter plots in A. (C) Distribution of correlation coefficients for the 496 pairs corresponding to the scatter plots in A.

