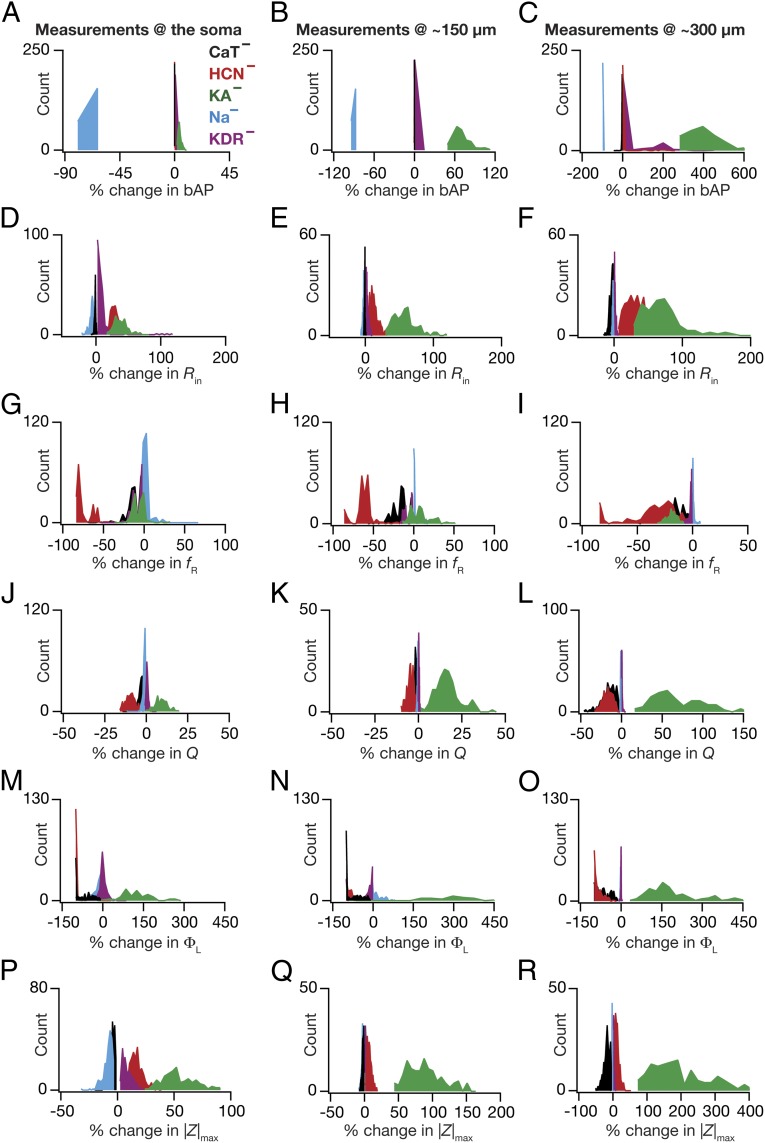
Fig. 5.
Virtual knockout of specific conductances from the population of valid models had diverse impacts on physiological measurements. (A–R) Distributions of percentage changes in back-propagating action potential (bAP) amplitude (A–C), input resistance (Rin) (D–F), resonance frequency (fR) (G–I), resonance strength (Q) (J–L), total inductive phase (ΦL) (M–O), and maximum impedance amplitude (|Z|max) (P–R) after removing a specific conductance from the population of valid models at three different locations (soma, 150 µm, and 300 µm; Fig. 1A). For all panels, the histograms for specific conductances are color coded as in the labels in A.

