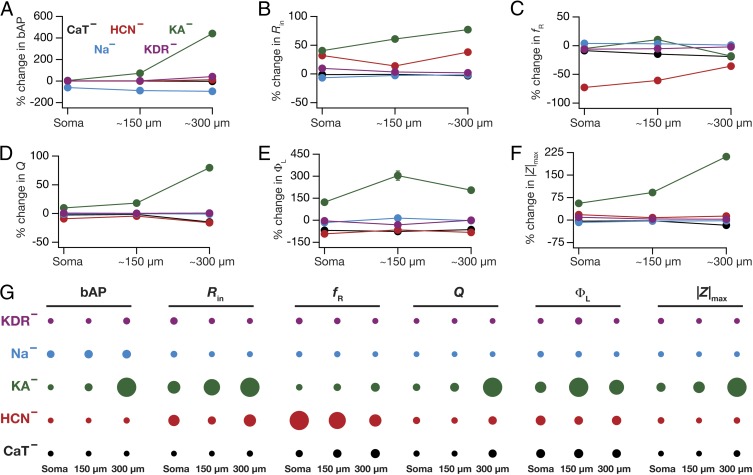
Fig. 6.
Virtual knockout of specific conductances reveals contrasting contributions of different conductances to individual physiological measurements. (A–F) Percentage changes (represented as mean ± SEM) at three different locations (soma, 150 µm, and 300 µm; Fig. 1A) corresponding to back-propagating action potential (bAP) amplitude (A), input resistance (Rin) (B), resonance frequency (fR) (C), resonance strength (Q) (D), total inductive phase (ΦL) (E), and maximum impedance amplitude (|Z|max) (F) after removing a specific conductance from the population of valid models. For all panels, the plots for specific conductances are color coded as in the labels in A. (G) Quantification of the relative impact of different conductances on specific physiological measurements recorded at each of the three locations. The relative effect of each conductance on a given physiological measurement at each location is specified by the diameter of the circle against that combination. The largest and the smallest diameters were measurement specific and were assigned to the maximum and minimum absolute changes, respectively, of the measurement spanning all locations and conductances.

