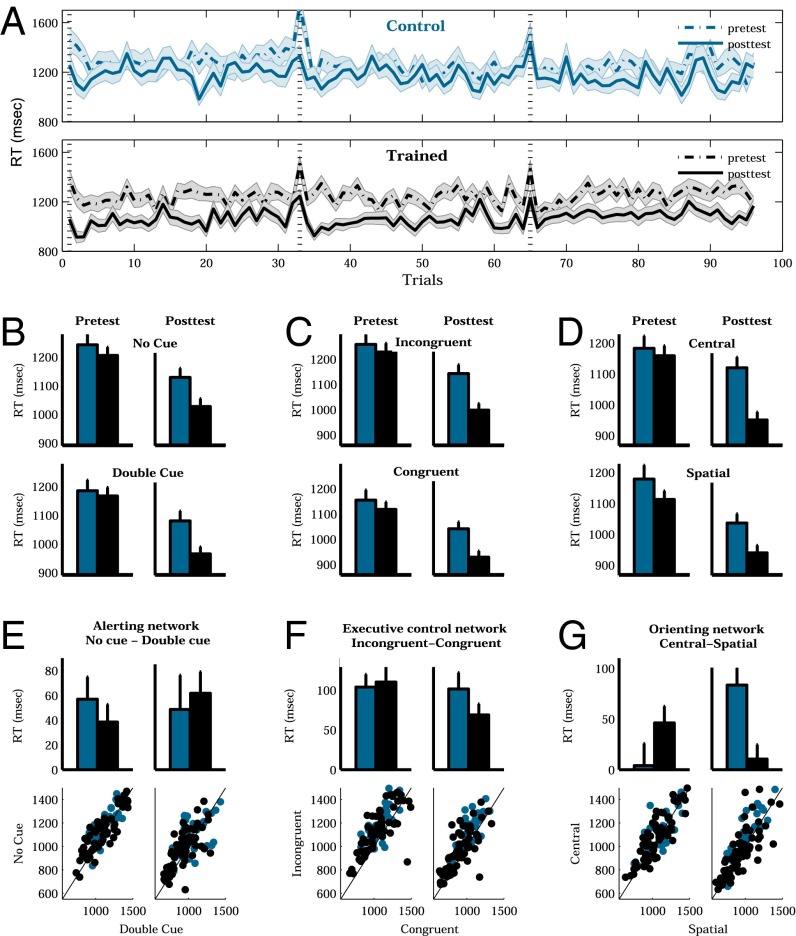
Fig. 1.
(A) Response time to the child ANT task for both test phases (dotted line, pretest; full line, posttest) and experimental group (Upper, blue: control; Lower, black: trained). Lines indicate the mean response times (RT) for each trial. The dotted vertical lines indicate the first trial of each block. Shadowed areas indicate SEs. (B–D) Attentional network components of the child ANT task. Black, trained; blue, control. (Left) Pretest. (Right) Posttest. Bars indicate mean RT. Error bars indicate SEs. (E–G, Upper) Mean scores of each attentional network (substraction). Black, trained; blue, control. (Left) Pretest. (Right) Posttest. Bars indicate mean RT. Error bars indicate SEs. (E–G, Lower) Correlation between the two types of trial for each child (black dots, trained; blue dots, control).

