Fig. 4.
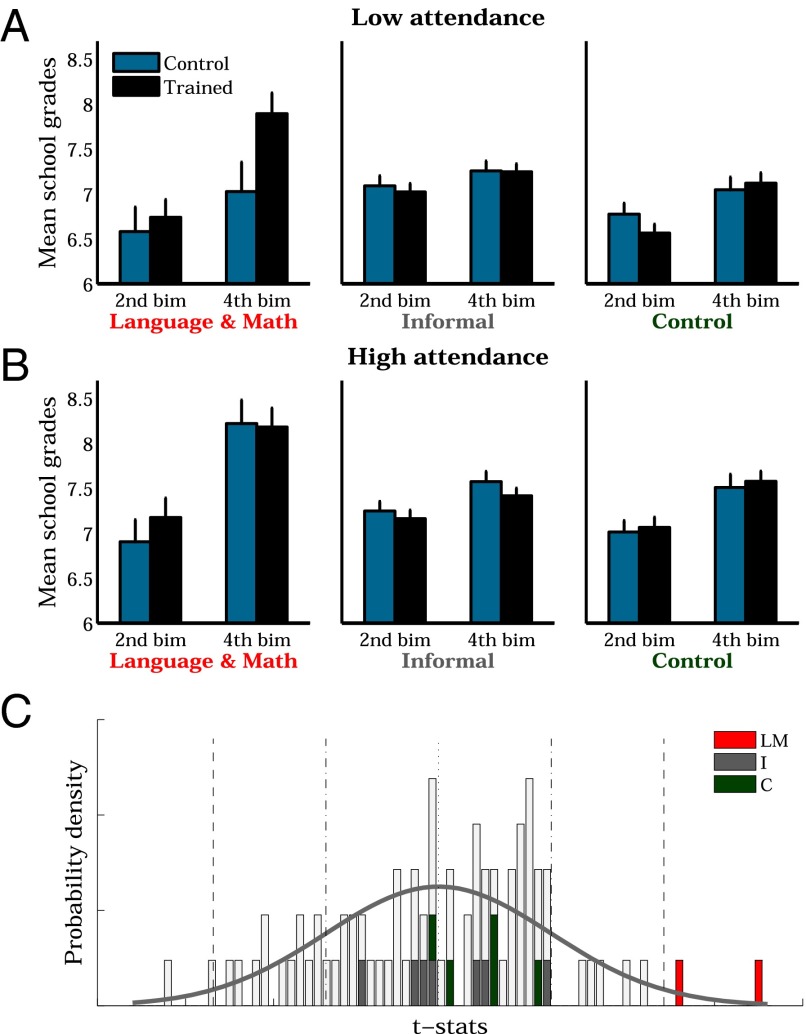
(A and B) Average class grades divided by children school attendance: low (A) or high attendance (B). Grades are shown for the second (before the intervention) and the fourth bimester (after the intervention). Error bars indicate SEs. (C) Probability density for all 84 t values trained-to-control comparisons (14 subjects, 2 groups for high and low school attendance, and 3 bimesters for first, second, and fourth). The dotted line indicates the mean and the dashed lines, the first and second SD of the distribution. t values corresponding to comparisons of low-attending children after the intervention (fourth bimester) are colored according to the group of subjects (dark gray, informal subjects; green, control subjects; red, language and math). t values for all subjects for first and second bimester and for the fourth bimester of the high attendance group are light gray. Note that language and math after the intervention (red) correspond to the higher ranked (to the foremost right) t values of all comparisons.

