Fig. 3.
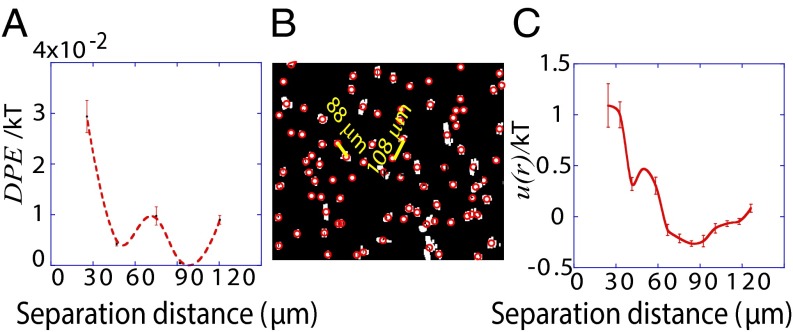
Predicting spatial distributions of U87EGFRvIII cells in bulk cell culture. (A) The DPE function provides a measurement of the deviation of two interacting cells from the steady state; it has a value near zero at midrange and a secondary minimum near 40 μm. The error bars were calculated by propagating errors associated with the mean values of measured proteins as a function of distance (SI Text, Determination of the Errors for the Calculated Parameters Obtained from Surprisal Analysis). (B) Using custom algorithms, optical micrographs of U87EGFRvIII cells in bulk culture were digitized and analyzed so that all cell pairs, up to a separation distance of 200 μm were measured, for ∼10,000 cell pairs. The resultant histogram provides a probability for finding a pair of the cells at a certain distance. The obtained probability was divided by a random probability of cell–cell distance distributions. This result was used as an input to calculate RDF. (C) The potential energy  of cell–cell interactions was calculated from the RDF. Values are mean ± SEM (n = 5). In every biological replicate
  cell pairs were found that had a separation distance of ≤200 μm and were used to calculate RDF and
  functions.

