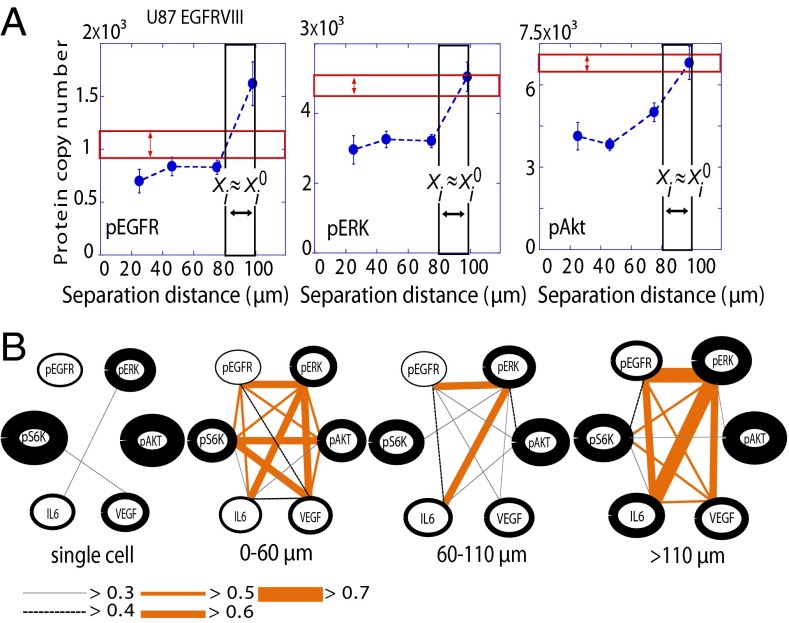
Fig. 5.
Comparisons of noninteracting U87EGFRvIII single cells with interacting cell pairs. (A) Mean values of protein levels, as measured for U87EGFRvIII single cells (n = 880), are compared against measurement of those same proteins for cell pairs, at cell separation distance ranges close to the steady state (80–100 μm for U87EGFRvIII cells) or deviating significantly (20–30 μm for U87EGFRvIII cells). The red box represents the measured range of copy numbers (multiplied by 2, ± SEM) for single cells. The black box is that range for cell pairs at the steady state, and the blue dots represent average levels for two-cell assays at different intercellular separations. (B) Protein–protein coordination maps were generated using U87EGFRvIII two-cell and single-cell data. To compute protein–protein Pearson correlation coefficients, the data were binned into the three distance ranges to achieve a statistics of more than 100 cells per distance bin. The thickness of the lines encircling the protein names reflects the relative abundance of those proteins. The single-cell data were multiplied by 2 for comparison. The thickness and color of the edges reflect the extent of the protein–protein coordination (P < 0.05) as provided in the key below the networks.

