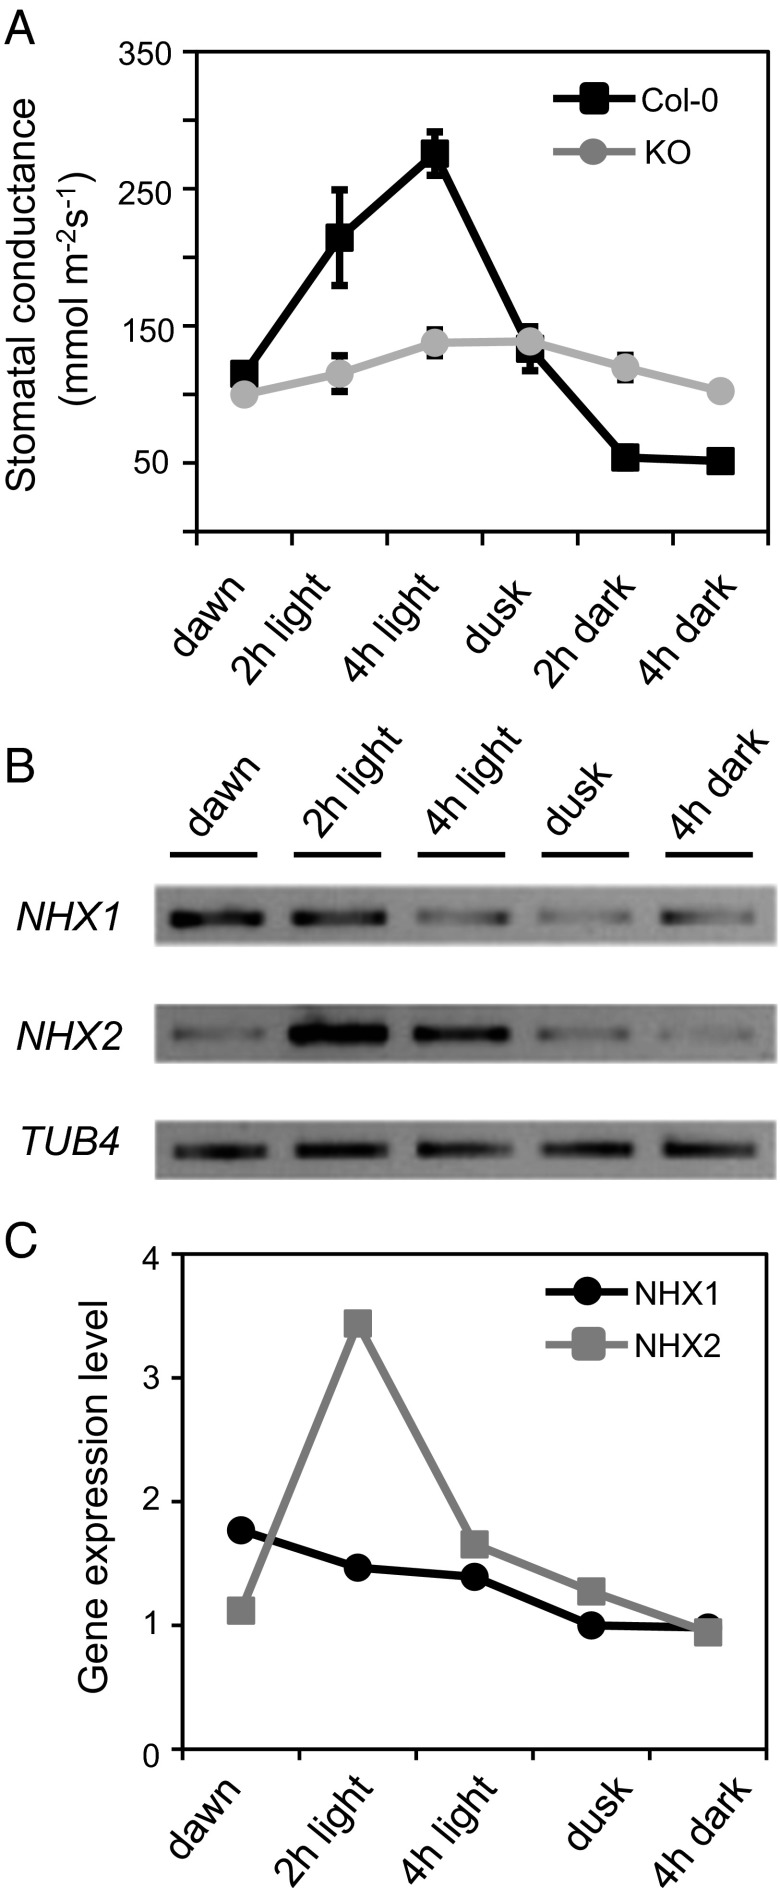
Fig. 2.
Diurnal rhythms of stomatal conductance and NHX transcript abundance. (A) In planta stomatal conductance measurements in Col-0 and KO leaves at different time points of the day/night cycle. Dawn and dusk samples were collected 15 min before the light was switched on and off, respectively. Data represent mean and SE of three plants per line. Mean values were statistically different between WT and KO line (P < 0.05) in pairwise comparison at each time point by Tukey HSD test, except for values at the onset of light and at dusk. (B) RT-PCR analysis of NHX1 and NHX2 mRNA expression levels in whole leaves at different time points of the day/night cycle. The gene TB4 encoding β-tubulin-4 was used as loading control. (C) Relative NHX1 and NHX2 gene expression level at different time points of the day/night cycle calculated by densitometry analysis of the bands shown in B. Each point represents the mean of three different samples per line calculated after normalization to TB4. Arbitrary units of gene expression are relative to transcript abundance at 4 h of darkness.

