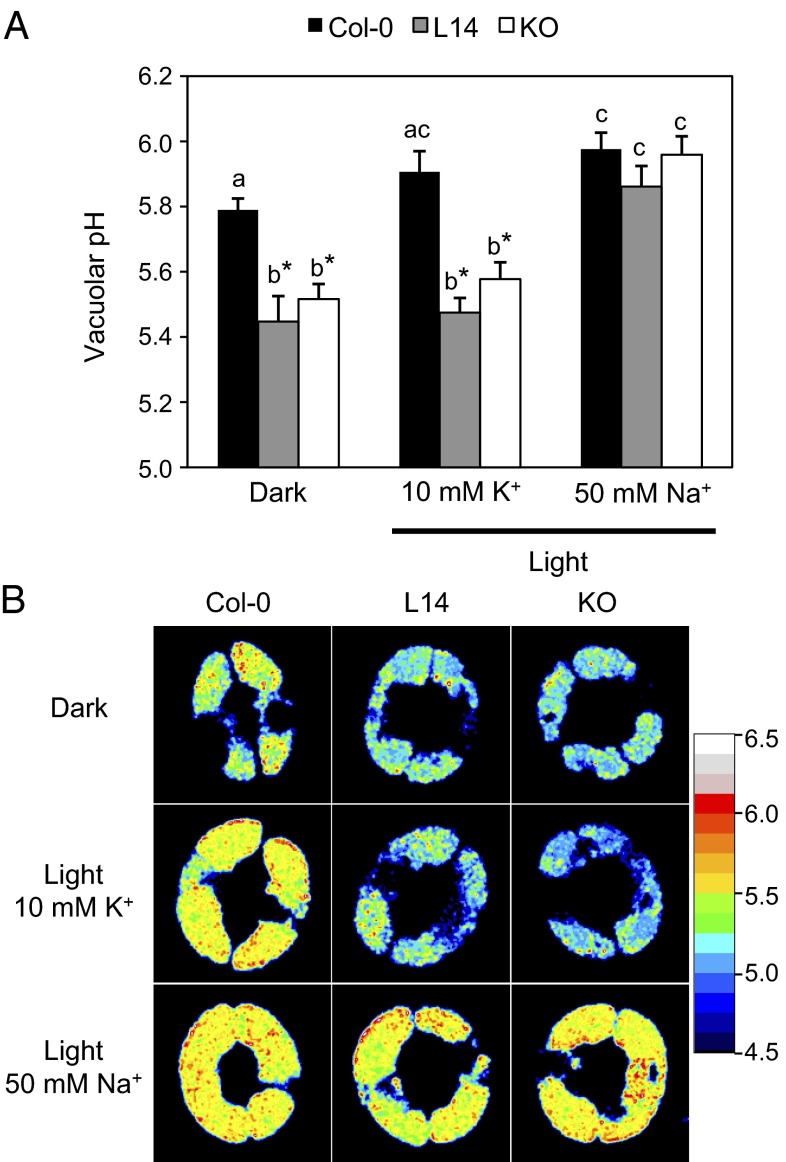
Fig. 8.
Acidification of pHv in mutant guard cells. (A) pHv measured after light-induced stomatal opening in the presence of 10 mM KCl or 50 mM NaCl in guard cells loaded with the pH-sensitive dye Oregon green. Data represent the mean and SE of pHv values of at least 20 stomata per line and per treatment. Asterisks indicate statistically significant differences relative to WT for each treatment (P < 0.001) in pairwise comparison by Tukey HSD test. Letters indicate statistically significant differences between treatments for each line (P < 0.001) in pairwise comparison by Tukey HSD test. (B) Representative ratiometric images of WT and nhx1 nhx2 mutant guard cells generated by dividing the emission images obtained in the 488-nm channel by those acquired in the 458-nm channel.

