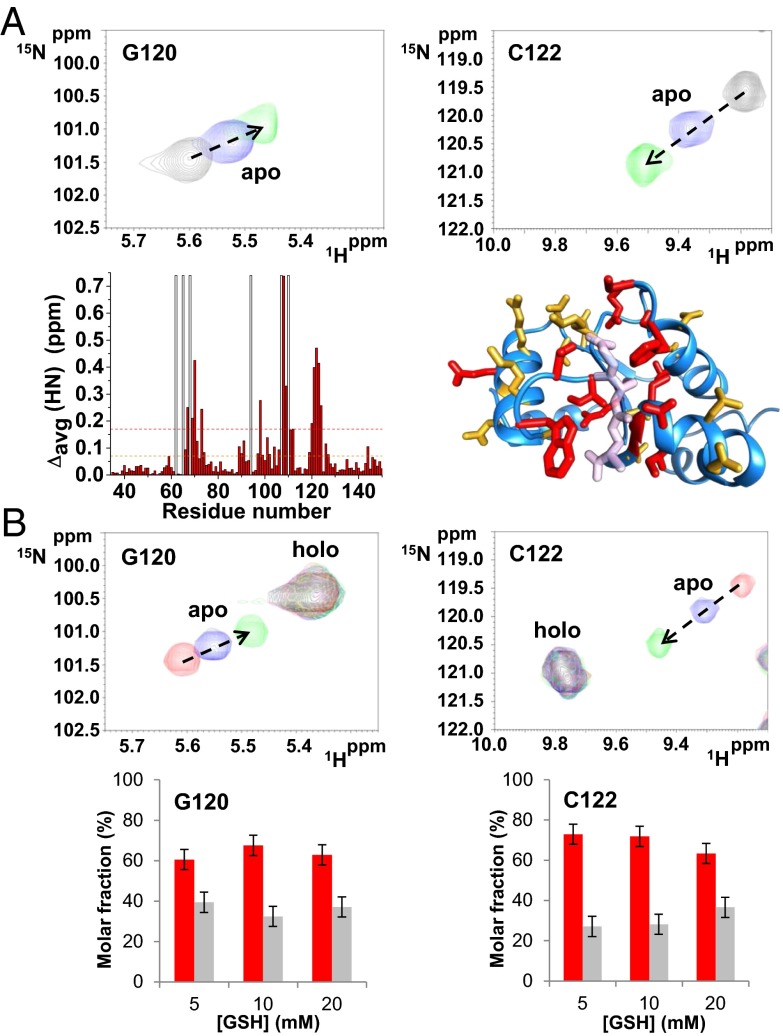
Fig. 1.
Interaction of glutathione with apo and holo hGRX5. Chemical shift changes of G120 and C122 residues induced by the addition of different GSH concentrations (5, 10, and 20 mM) in apo (A) and holo hGRX5 (B) (the latter sample contains a residual 30% of apo hGRX5) are shown. (A) Backbone weighted average chemical shift differences Δavg(HN) [i.e., ((ΔH)2 + (ΔN/5)2)/2)1/2, where ΔH and ΔN are chemical shift differences for 1H and 15N, respectively] observed upon addition of 20 mM GSH to 15N-labeled apo hGRX5. White bars indicate Pro residues and the unassigned backbone NH of Gly-68. Thresholds of 0.17 ppm (mean value of Δavg(HN) plus 1σ, red dashed line) and a lower one of 0.07 ppm (orange dashed line) were used to identify primary and secondary effects on the chemical shift changes. Residues with Δavg(HN) values greater than 0.17 ppm and 0.07 ppm are shown in red and orange, respectively, on a subunit of the tetrameric crystal structure of holo hGRX5. GSH molecule is shown in light pink. (B) Molar fractions of the apo (gray) and holo (red) forms of Gly-120 and Cys-122 residues are reported at increasing GSH concentrations. The values were obtained integrating the corresponding NH signals in the 1H-15N HSQC maps recorded on holo hGRX5 samples containing 5, 10, and 20 mM GSH concentrations. Error bars show the SD from two independent experiments.

