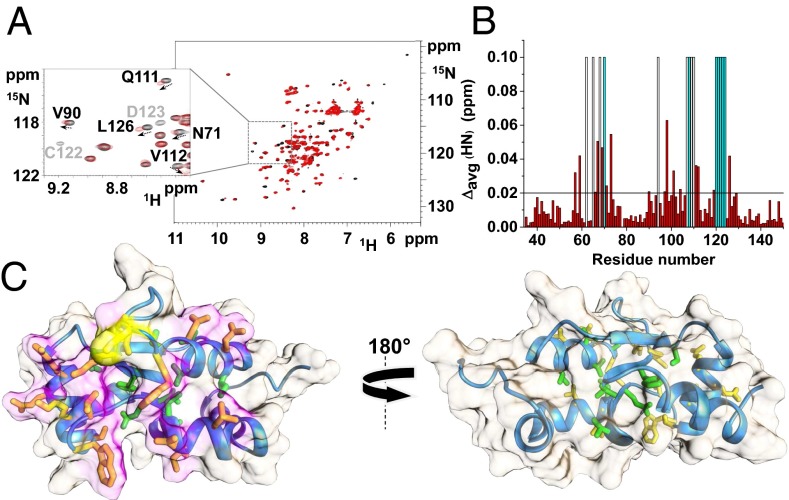
Fig. 3.
Complex formation between hGRX5 and hISCA1. (A) 1H-15N HSQC spectrum of 15N-labeled apo hGRX5 before (black) and after (red) the addition of two equivalents of unlabeled holo hISCA1. (Inset) Shift of signals (indicated by an arrow) and beyond detection broadening effects (indicated in light gray) observed upon the addition of holo hISCA1. (B) Backbone weighted average chemical shift differences Δavg(HN) between 15N-labeled apo hGRX5 and the 2:1 unlabeled holo hISCA1/15N-labeled apo hGRX5 mixture. White bars indicate Pro residues and the unassigned backbone NHs of Gly-68 (in both apo form and mixture) and Ile-109 (in the mixture). Cyan bars indicate residues whose backbone NH signals broaden beyond detection at 2:1 protein ratio. A threshold of 0.02 ppm [mean value of Δavg(HN) plus 1σ] was used to identify meaningful chemical shift differences. (C) The meaningful chemical shift variations are mapped on the solution structure of apo hGRX5. Side chains of residues with Δavg(HN) values greater than the threshold of 0.02 ppm are shown in yellow/orange (solvent-exposed) and green (buried in the protein core). The interacting surface is in magenta and Cys-67, also showing a Δavg(HN) higher than 0.02 ppm, is in yellow. A 180° rotated view on the right shows that the interaction specifically involves residues on one side of the protein, where the GSH/[2Fe-2S] cluster binding region is located.

