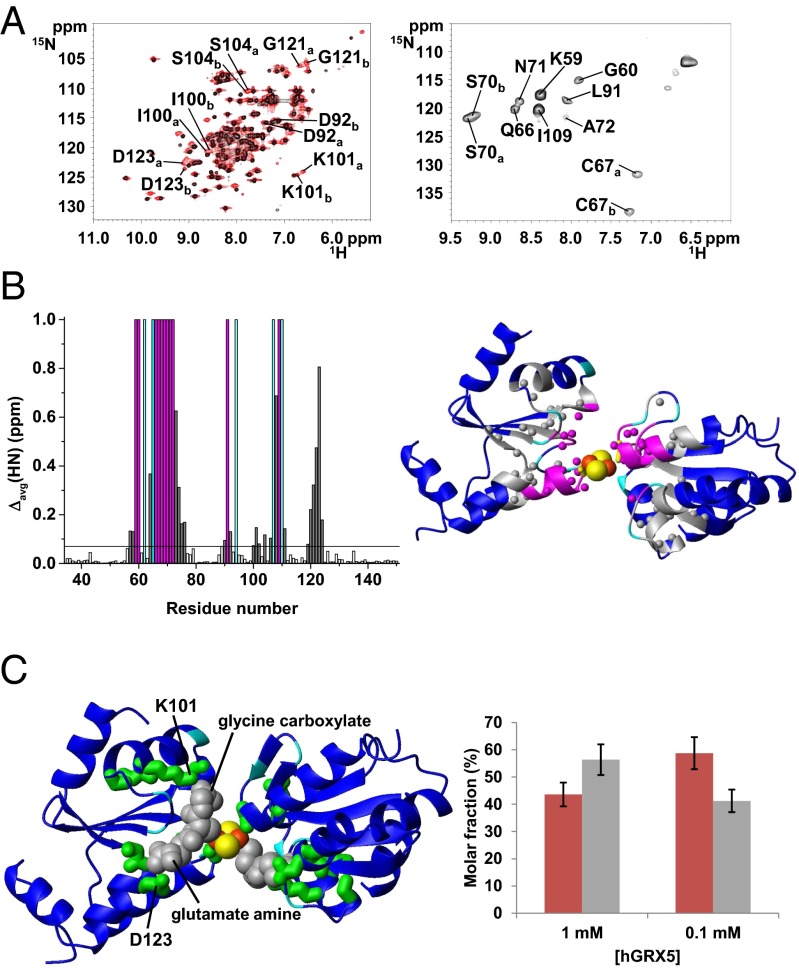
Fig. 5.
Structural characterization of holo hGRX5 by solution NMR. (A) (Left) An overlay of 1H-15N HSQC spectra of 15N-labeled 1 mM apo hGRX5 (black) and holo hGRX5 (red) at 900 MHz. (Right) The 1H-15N IR-HSQC-AP spectrum of 1 mM holo hGRX5 at 800 MHz is displayed reporting the paramagnetic NH signals and their assignment. The residues having two sets of signals in holo hGRX5 are indicated with a and b labels. (B) (Left) Backbone weighted average chemical shift differences Δavg(HN) between apo and holo hGRX5. Meaningful chemical shift differences (threshold of 0.07 ppm) are shown in gray. The NH signals of 11 residues of holo hGRX5 (in magenta) are not detected in the diamagnetic 1H-15N HSQC experiments. (Right) Mapping the meaningful chemical shift variations (in gray) on the two [2Fe-2S]-bridged subunits of the crystal structure of holo hGRX5. Magenta and gray spheres represent backbone NHs. The side chain of the iron ligand Cys-67 is shown in yellow. Pro residues, iron, and sulfur atoms are colored in cyan, orange, and yellow, respectively. For clarity the GSH molecules are not depicted. (C) (Left) Mapping the eight residues with two sets of signals (in green) on two dimeric subunits coordinating the cluster in the crystal structure of holo hGRX5. GSH molecules are colored in gray. (Right) Molar fractions of holo hGRX5a (red) and holo hGRX5b (gray) are reported at 1 mM and 0.1 mM holo hGRX5 solution in 50 mM phosphate buffer, 5 mM DTT, and 5 mM GSH.

