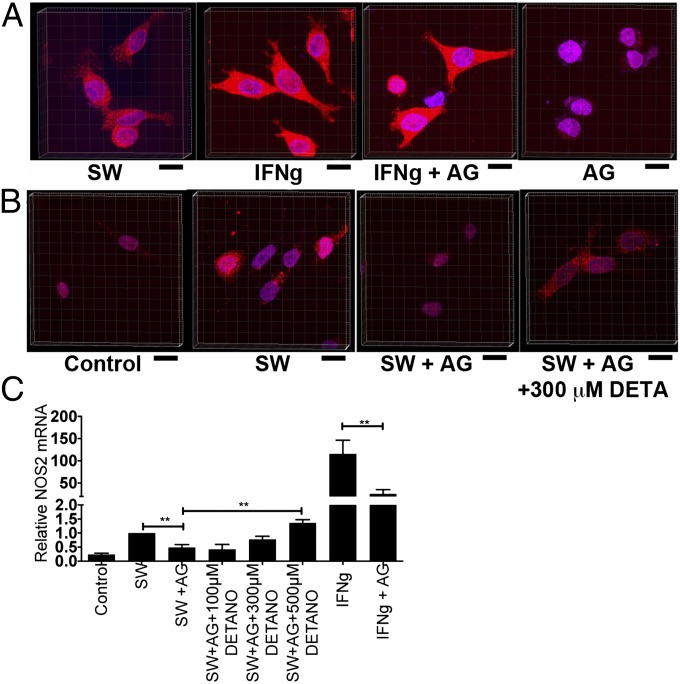
Fig. 2.
Confocal microscopy of NOS2 protein expression in MDA-MB-231–treated cells. (A) SW and IFN-γ with or without AG-treated cells. (B) SW with or without AG or 300 μM DETA/NO. (C) AG decreases NOS2 mRNA expression in SW and IFN-γ–treated cells and titration of DETA/NO reestablishes NOS2 mRNA expression to control levels in SW+AG treated cells (±SEM, **P ≤ 0.01). (Scale bars: 20 μm.)

