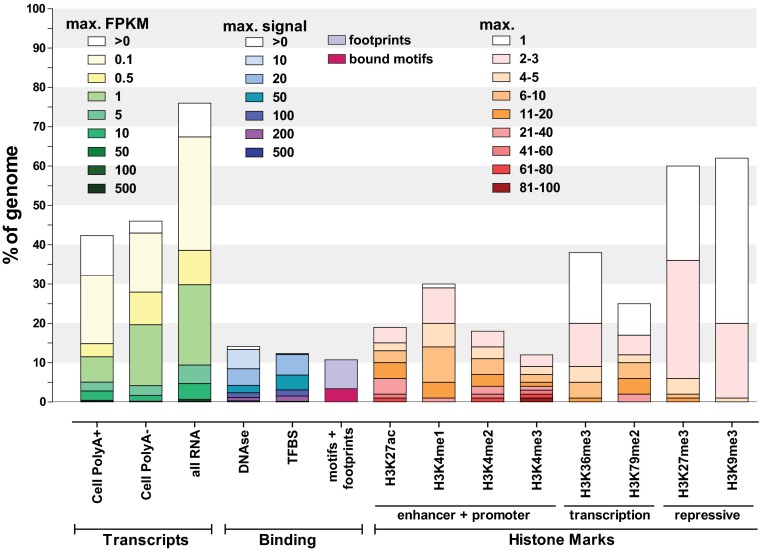
Fig. 2.
Summary of the coverage of the human genome by ENCODE data. The fraction of the human genome covered by ENCODE-detected elements in at least one cell line or tissue for each assay is shown as a bar graph. All percentages are calculated against the whole genome, including the portion that is not uniquely mappable with short reads and thus is invisible to the analysis presented here (see Fig. S1). A more detailed summary can be found in Fig. S2. For transcripts, coverage was calculated from RNA-seq–derived contigs (104) using the count of read fragments per kilobase of exon per million reads (FPKM) and separated into abundance classes by FPKM values. Note that FPKMs are not directly comparable among different subcellular fractions, as they reflect relative abundances within a fraction rather than average absolute transcript copy numbers per cell. Depending on the total amount of RNA in a cell, one transcript copy per cell corresponds to between 0.5 and 5 FPKM in PolyA+ whole-cell samples according to current estimates (with the upper end of that range corresponding to small cells with little RNA and vice versa). “All RNA” refers to all RNA-seq experiments, including all subcellular fractions (Fig. S2). DNAse hypersensitivity and transcription-factor (TFBS) and histone-mark ChIP-seq coverage was calculated similarly but divided according to signal strength. “Motifs+footprints” refers to the union of occupied sequence recognition motifs for transcription factors as determined by ChIP-seq and as measured by digital genomic footprinting, with the fuscia portion of the bar representing the genomic space covered by bound motifs in ChIP-seq. Signal strength for ChIP-seq data for histone marks was determined based on the P value of each enriched region (the –log10 of the P value is shown), using peak-calling procedures tailored to the broadness of occupancy of each modification (SI Methods).

