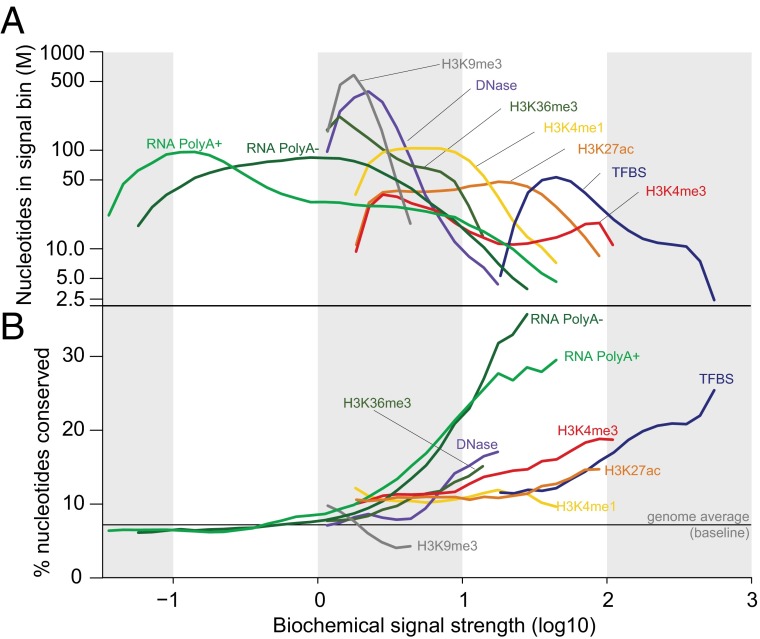
Fig. 3.
Relationship between ENCODE signals and conservation. Signal strength of ENCODE functional annotations were defined as follows: log10 of signal intensity for DNase and TFBS, log10 of RPKM for RNA, and log10 of −log10 P value for histone modifications. Annotated regions were binned by 0.1 units of signal strength. (A) The number of nucleotides in each signal bin was plotted. (B) The fraction of the genome in each signal bin covered by conserved elements (by genomic evolutionary rate profiling) (115) was plotted.

