Fig. 3.
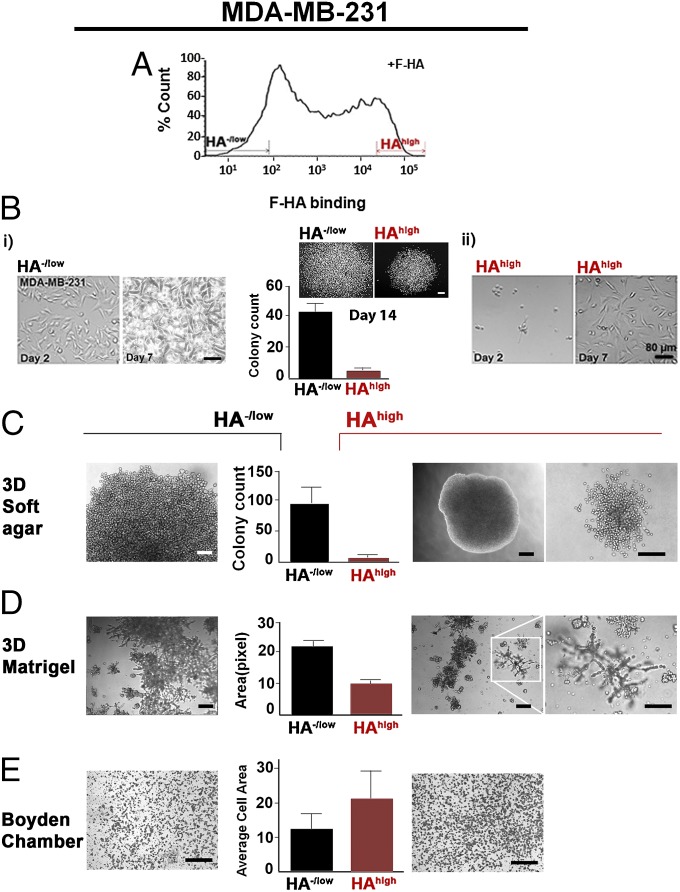
Sorting of BCa cells based on HA binding reveals subpopulations with distinct phenotypes. (A) Identification and isolation of HA−/low and HAhigh subpopulations based on differential binding of F-HA to MDA-MB-231 cells. n ≥ 20. (B) Markers indicate 8% selection. Two-dimensional morphology of (i) HA−/low and (ii) HAhigh subpopulations grown from the same number of cells on glass culture chambers from 2 to 7 d after sorting. n = 3–5. (Scale bars: 80 µm). (B, Center) Growth status of the two subpopulations measured by clonogenic abilities up to 14 d. P < 0.001; n = 5. (Scale bar: 200 µm.) Error bars represent SD. (C) Colony-forming ability of (Left) HA−/low and (Right) HAhigh on 3D soft agar by 2.5 mo after cell seeding. (C, Center) Quantification of colonies derived from HA−/low and HAhigh subpopulations. P < 0.0001; n = 5. (Scale bars: 80 µm.) Error bars represent SD. (D) Morphology of (Left) HA−/low and (Right) HAhigh subpopulation on 3D laminin-rich gels. The white inset is an example of invaded structures through Matrigel and (Right) increased magnification of the structures. n = 3. (Scale bars: 300 µm.) (D, Center) Quantification of the occupied surface area by colonies derived from HA−/low and HAhigh subpopulations. P < 0.06; n = 3. Error bars represent SD. (E, Center) Quantification of HA−/low and HAhigh subpopulation invasion through Matrigel-coated Boyden chambers as the average area occupied by (Left) HA−/low and (Right) HAhigh cells that were passed through chambers. P < 0.0005; n = 3. (Scale bar: 300 µm.) Error bars represent SD.

