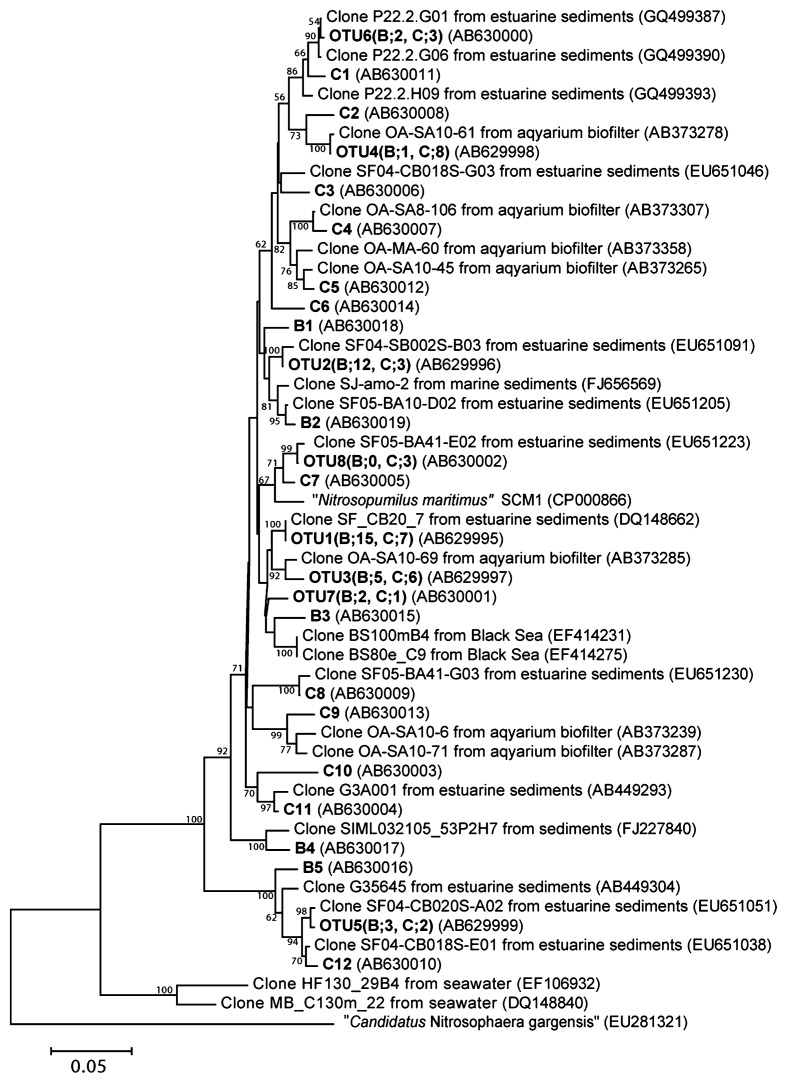
Fig. 4.
Neighbor-joining phylogenetic tree of archaeal amoA gene sequences (456 bp). Bold indicates the representative amoA clones obtained in this study. Letters and numbers in parentheses appended to each OTU denote clone numbers detected from each site. B1–B5 and C1–C12 denote singleton clones from sites B and C. Scale bar represents an estimated sequence divergence of 5%. Numbers at nodes indicate bootstrap values (>50%).

