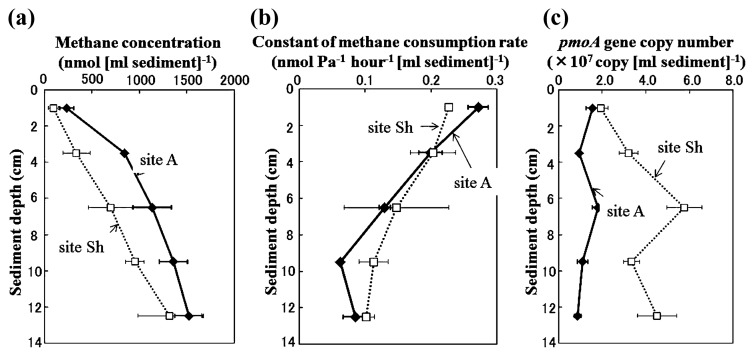
Fig. 2.
Vertical profiles of methane concentration (A), constant of aerobic methane oxidizing potential (B) and pmoA gene copy number (C) at sediments at site A (closed diamonds) and site Sh (open squares). Bars indicate standard deviation of triplicate samples, except for potential activities in 5–8 cm and 11–14 cm layers at site Sh measured in duplicate.

