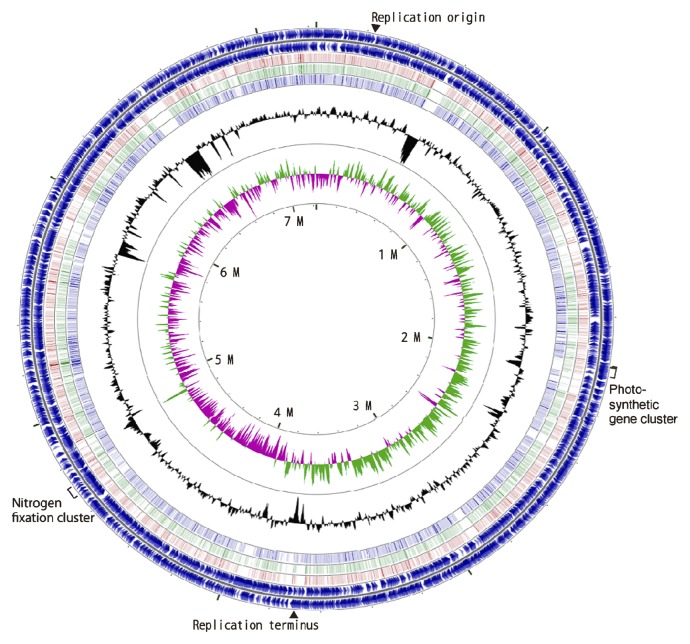
Fig. 2.
Circular representation of the chromosome of Bradyrhizobium sp. S23321. The outermost circle and the second circle show the positions of the putative protein-encoding genes in clockwise and counterclockwise directions, respectively. The third, fourth, and fifth circles from the outside represent BLASTN comparisons with Bradyrhizobium sp. BTAi1, Bradyrhizobium sp. ORS278, and B. japonicum USDA110, respectively (E-value <10−10). The innermost and second-innermost circles show the GC skew and the GC content, respectively. The GC content circle shows the deviation from the average GC content of the entire sequence (higher than average GC content in green, lower than average in purple). The markings inside the innermost circle represent genome positions in Mb. The positions of the putative replication origin, putative replication terminus, nitrogen fixation genes, and photosynthetic genes are shown outside of the outermost circle.

