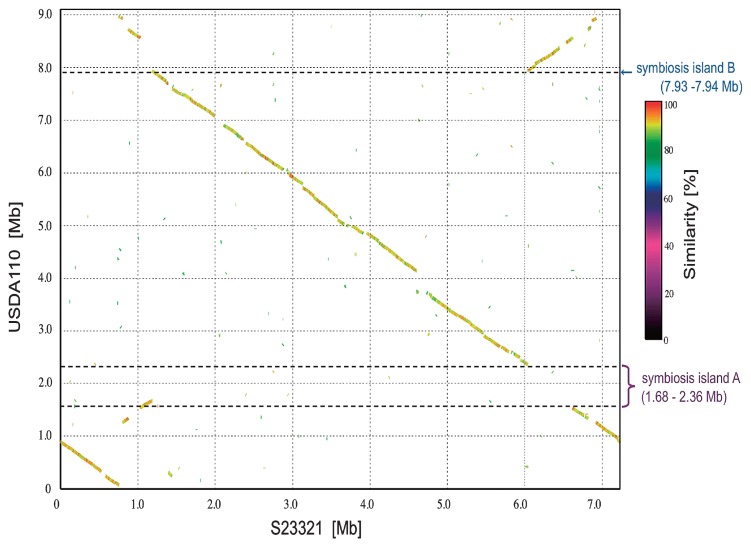
Fig. 4.
Comparison of the genome sequences of S23321 and USDA110. The nucleotide sequence of Bradyrhizobium sp. S23321 was compared with that of B. japonicum USDA110 by MUMmer and is represented by a syntenic dot plot of S23321 (x-axis) versus USDA110 (y-axis). Dot color indicates % similarity, as indicated by the key to the right of the graph.

