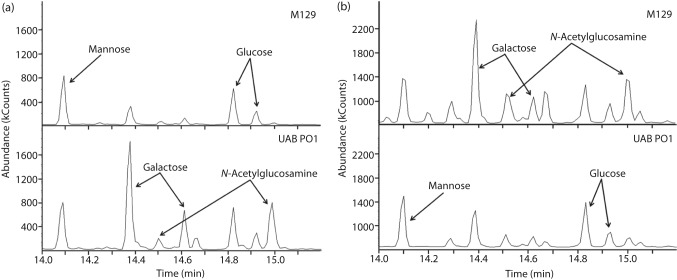
Fig. 7.
GC of polysaccharides from M. pneumoniae. GC analysis shows the peaks for the methyl glycosides of the monosaccharides mannose (shown as a single peak), and glucose, galactose and GlcNAc (shown as double peaks). The chromatograms represent the sugars derived from the polysaccharides associated with the cells (a) or the spent medium (b). The y axis represents the absorbance of the methyl glycosides eluted from the column, and the x axis represents the time for elution.

