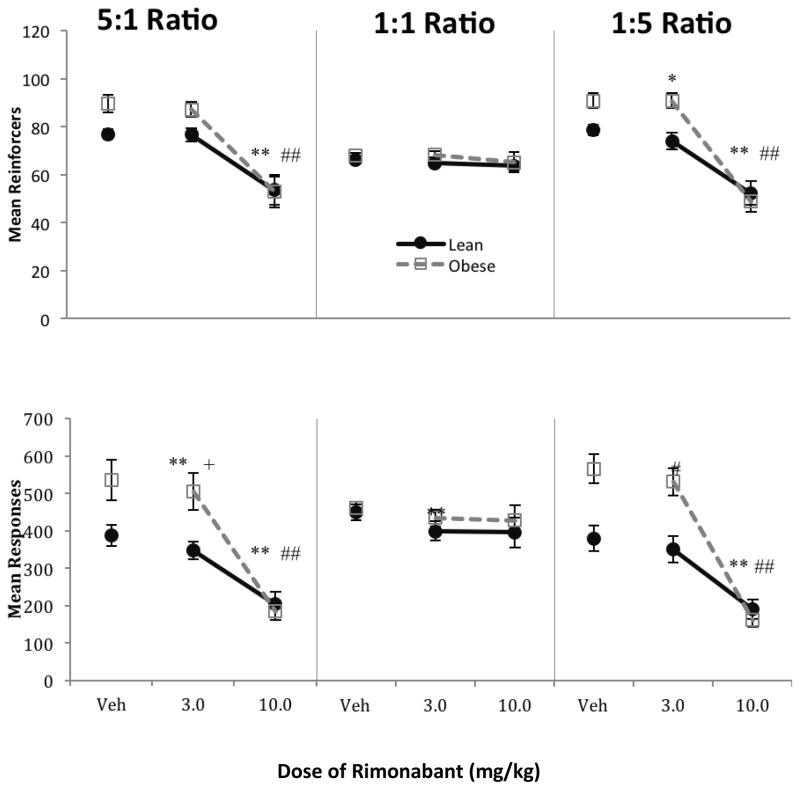
Fig. 1.
Mean total (left + right) reinforcers (top) and responses (bottom) per session as a function of dose of rimonabant under three food reinforcement ratios 5:1 (left), 1:1 (center), and 1:5 (right) in Phase 1. Lean rats are shown in closed circles, obese rats in open squares. Error bars = 1 SEM. Post hoc contrasts shown in Table 1a. Symbols represent post hoc contrasts comparing dose to vehicle.
* p < 0.05, ** p < 0.01

