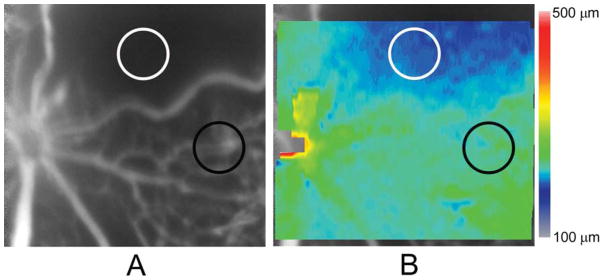
Figure 2.

(A) An example of a fluorescein angiogram (FA) image obtained in an oxygen induced retinopathy mouse displaying a hypovascular region with a paucity of capillaries and an avascular region without any visible capillaries, between major retinal blood vessels with irregular caliber and tortuosity. Hypovascular and avascular regions of interest (ROIs) are denoted by black and white circles, respectively. (B) A retinal thickness map generated in the same mouse and overlaid on the FA image, displaying thickness variations. Color bar displays retinal thickness in microns. Retinal thickness in the hypovascular (black circle) and avascular (white circle) ROIs were 227 μm and 195 μm, respectively.
