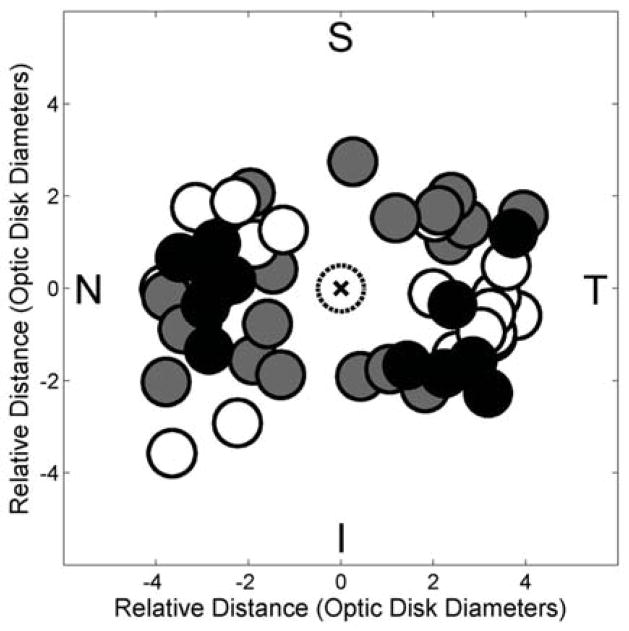
Figure 4.
Compiled locations of vascular regions of interest (ROIs) (black circles) of control mice, and hypovascular ROIs (gray circles) and avascular ROIs (white circles) of oxygen induced retinopathy mice plotted relative to the optic disk (dotted circle marked with an x). Nasal, temporal, superior, and inferior quadrants are denoted by N, T, S, and I, respectively.

