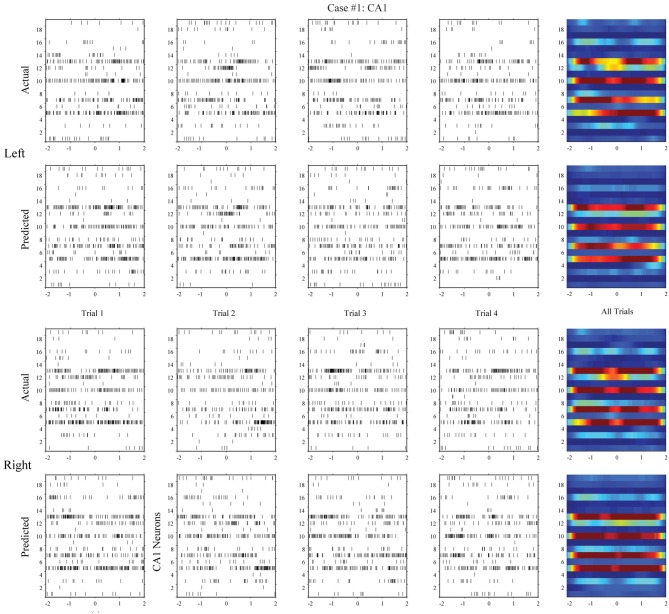
Figure 6.
Spatio-temporal patterns of spikes in the hippocampal CA1 (output) region during left and right events of the DNMS. For each position, the top row shows the actual CA1 spatio-temporal patterns; the bottom row shows the CA1 spatio-temporal patterns predicted by the MIMO model based on the ongoing CA3 spiking activities (case #1).

