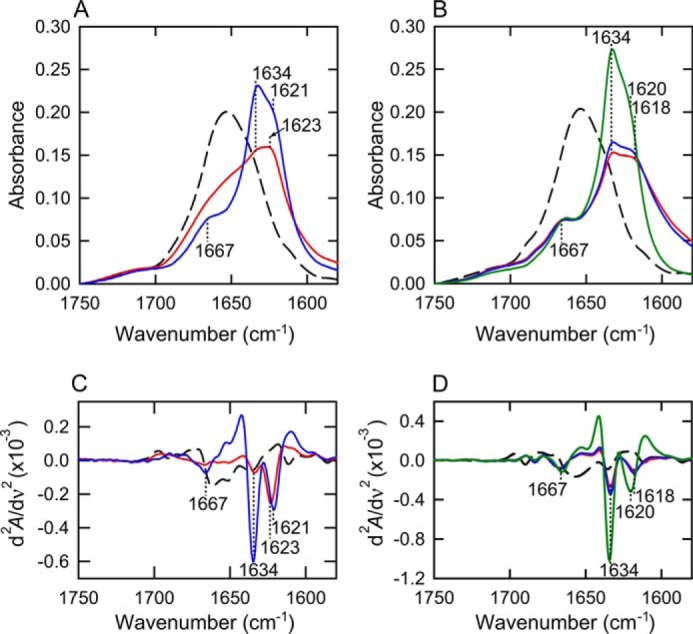
FIGURE 2.

FTIR absorption spectra of insulin amyloid fibrils obtained by repeated cycles of the heat treatment. A and B, the spectra at approximately the amide I region of fibrils formed after the 1st (red) and 2nd (blue) cycles of heat treatment at 1.0 m (A) and 0.1 m NaCl (B). FTIR measurements were performed at 25 °C. The black dashed lines represent the spectra of native insulin without any heat treatment as a reference. The spectrum of amyloid fibrils formed by repeated self-seeding at 0.1 m NaCl was also shown in a green line for reference. Spectra were normalized so that the integrated intensity of the amide I band ranging from 1580 to 1750 cm−1 was set to be equal. C and D, second-derivative infrared spectra at 1.0 m (C) and 0.1 m NaCl (D). The colors are the same as those in panels A and B.
