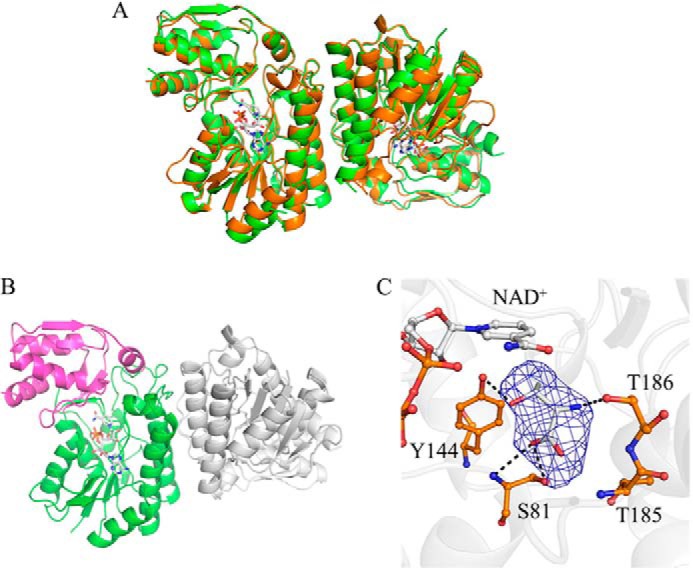
FIGURE 1.

Crystal structures of CnThrDH (apo) and CnThrDH (holo) forms. A, superposed structures of the apo (green) and the holo (orange) forms. NAD+ is shown as stick model (gray). These two structures are similar to each other; the RMSD between these forms was 0.44 Å2. B, structure of catalytic domain and NAD+ binding domain of the CnThrDH (holo). The catalytic domain (amino acids 176–214, 245–279, and 301–313) and the NAD+ binding domain (amino acids 1–175, 215–244, and 280–300) are colored magenta and green, respectively. C, l-Thr binding form of the CnThrDH (holo). Fo-Fc difference Fourier map (2.5 σ, in blue mesh) is superposed on the stick model of l-Thr. Potential hydrogen bonds (broken lines) with lengths less than 3.4 Å are shown.
