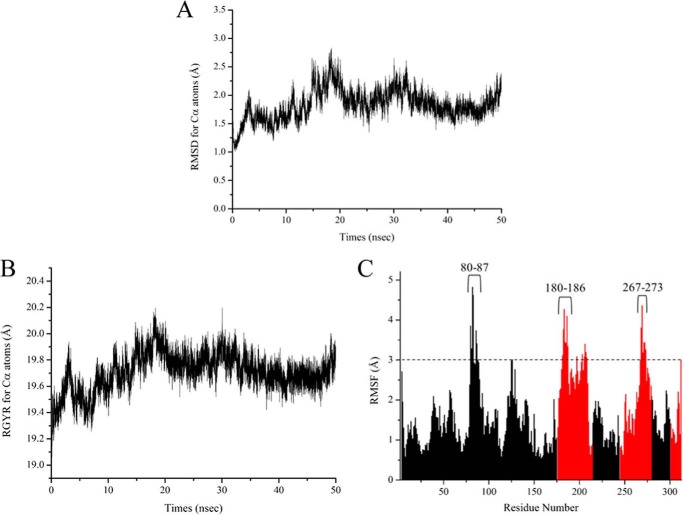
FIGURE 3.
A and B, plots of time-dependent change of RMSD values (A) and radius of gyration (RGYR) values (B) for Cα atoms of the CnThrDH (holo, with NAD+) structure. C, plots of RMSF values of the CnThrDH (holo, with NAD+) form. RMSF values were calculated using all trajectory data (total, 50,000 structures) outputted from the 50-ns MD simulation. The values corresponding to residues belonging to the NAD+-binding domain (amino acids 1–175, 215–244, and 280–300) and catalytic domain (amino acids 176–214, 245–279, and 303–313) are colored black and red, respectively.

